Guides27 Oct 202633 min read
Colour determinism in generated product media
A visual field guide to light, material, colour fidelity and temporal stability, with worked calculations, 59 Meta AI illustrations and an actual development comparison.
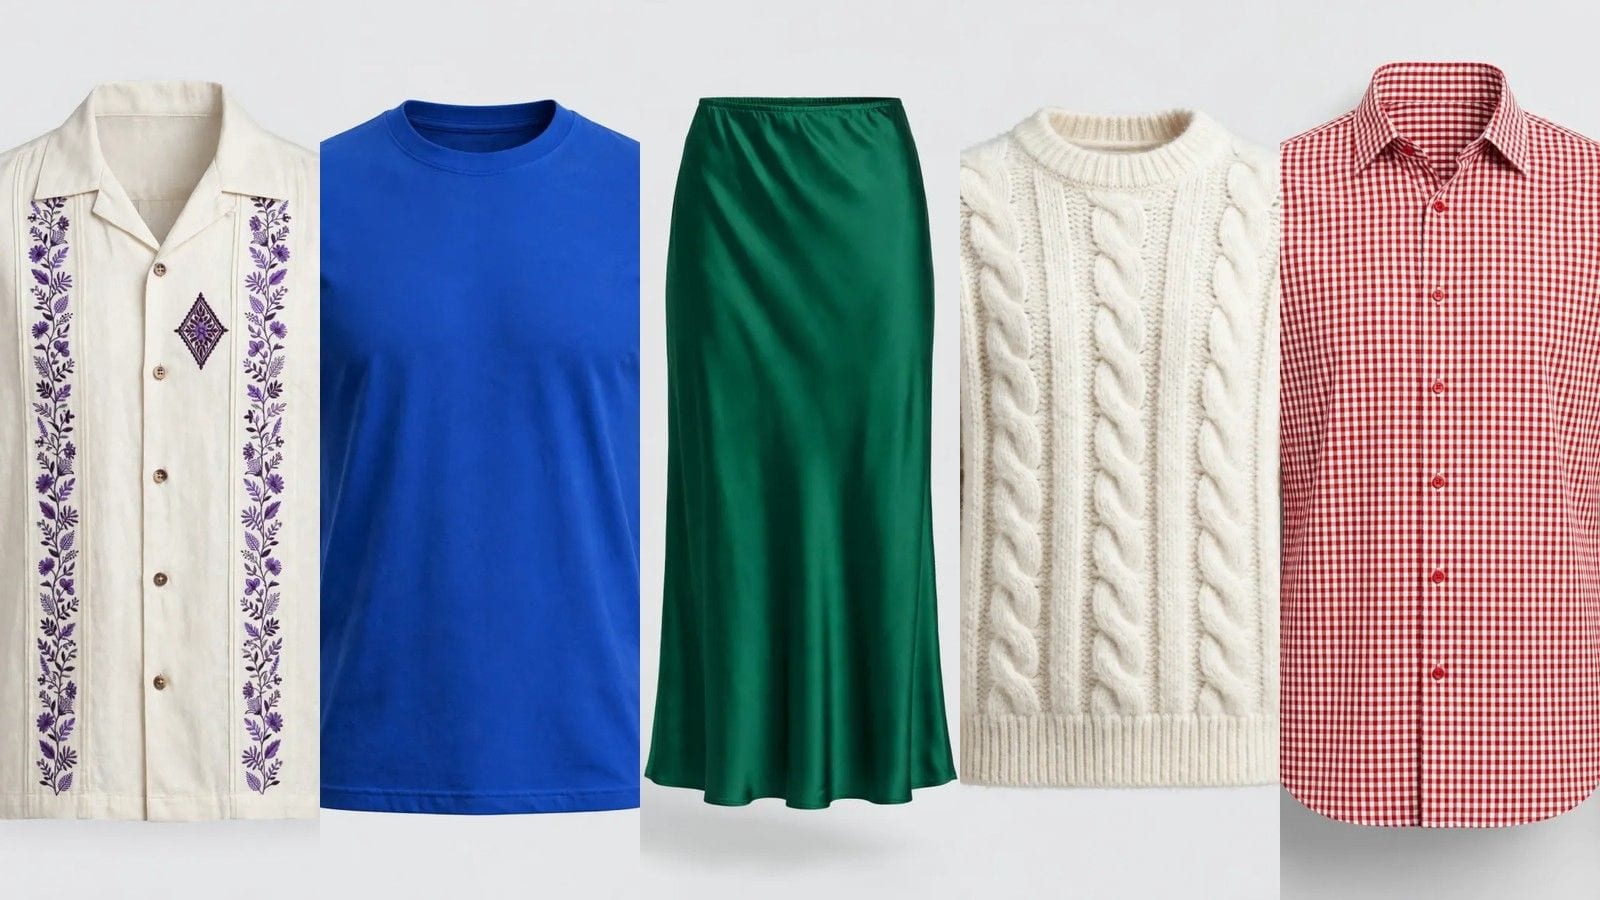
Change the scene. Keep the product.
A visual field guide to light, material, colour fidelity and temporal stability, with worked calculations, 59 Meta AI illustrations and an actual development comparison.
Visual field guide / expanded 8 October 2026
Colour is a relationship. Not a paint bucket.
A cream shirt can turn grey without looking fake. A blue tee can look perfect in one frame and change shade as it turns. A stable video can still show the wrong product. Understanding those differences is the starting point for useful colour research.
- 01 / Understand: Light, material, encoding and perception
- 02 / Look closely: 59 Meta AI illustrations, organised by failure mode
- 03 / Examine evidence: An actual archived correction comparison
- 04 / Test a claim: Calculations, experimental design and prompts
Foundations / 01
From a surface to a pixel
Start with a physical shirt. Light arrives with a distribution of energy across wavelengths. The material absorbs some of it and returns some of it toward the camera. A camera integrates that arriving light through its spectral sensitivities. Exposure, white balance, tone mapping and colour encoding then help determine the image we see. The photograph is an observation of this chain, not a direct reading of the dye.
- Illumination: What light arrives?
- Material + geometry: What light leaves?
- Camera + processing: What is recorded?
- Encoding + display: What do we see?
A simplified diffuse-surface teaching model writes a linear camera channel as an integral. Here E is incident spectral illumination, ρ is reflectance, s_c is the sensitivity of channel c, and k absorbs fixed scale factors. Geometry, fluorescence, interreflections, transmission and specular effects are omitted. Real camera processing is also outside this expression.
q_c = k ∫ E(λ) ρ(λ) s_c(λ) dλ

Toy three-band example, arbitrary units, k = 1:
ρ = (0.2, 0.5, 0.8)     s = (0.2, 0.6, 0.2)
E₁ = (1.0, 1.0, 1.0) → q₁ = 0.04 + 0.30 + 0.16 = 0.50
E₂ = (0.5, 1.0, 1.5) → q₂ = 0.02 + 0.30 + 0.24 = 0.56
The surface did not change; the simplified channel response increased by 12%. These invented three-band values explain a dependency, not a realistic spectral simulation. The general relationship between spectra, sensor responses and tristimulus values is developed in Physically Based Rendering’s chapter on colour.
Why three numbers cannot recover the whole material
Different spectral combinations can yield the same tristimulus match under one condition and disagree under another. This is why a photographic match does not certify the same appearance under every lamp or for every observer. The CIE definition of a metamerism index explicitly concerns mismatch after changing the illuminant or observer. An RGB-only illustration cannot prove that two physical fabrics are metameric; the required spectral evidence is missing.
What the eye adds
A garment is rarely viewed against an empty numerical coordinate system. Its surround, nearby colours and light–dark relationships shape the judgement. The demonstration below keeps both central squares exactly the same CSS colour. Only their surrounds differ. The effect may vary by viewer and display; the equality of the two specified colours does not.

Foundations / 02
The numbers need a colour space
An RGB triplet needs an encoding to be meaningful. Primaries, white point and transfer function determine its interpretation; conversion and relabelling are different operations. sRGB values are nonlinear. A channel value of 0.5 corresponds to approximately 0.214 in relative linear-light sRGB, not half the maximum light. The W3C colour-conversion examples specify the piecewise conversion.
For an encoded sRGB channel u in [0, 1]:
linear(u) = u / 12.92                       if u ≤ 0.04045
            ((u + 0.055) / 1.055)^2.4       otherwise

linear(0.5) ≈ 0.214041
encoded(0.5 linear) ≈ 0.735357
Averaging has assumptions
A 50:50 average of encoded black and white is 0.5; an equal linear-light mixture, re-encoded, is about 0.735. Neither observation means one universal averaging operation is correct for every task. It means that an author must state the domain of a calculation rather than use the word brightness for several different quantities.
Screen colour and printed colour
CMYK values refer to a printing condition, including the process and substrate. They are not a universal translation of an RGB colour. The ICC registry of CMYK characterisation data distinguishes printing conditions and associated profiles. A screen reproduction of a swatch cannot by itself certify a physical textile or ink match. The scientific question is always: agreement under which conditions, using which reference?
Delivery belongs in the experiment
A lossless intermediate, a compressed video and its browser playback are different observation points. Decoding, range interpretation, colour metadata, scaling and compression should be checked before a discrepancy is attributed to the correction process. Chroma subsampling reduces colour sampling relative to the luma grid; fine coloured motifs deserve inspection in the delivered file, not only the working image. The EBU sampling terminology distinguishes these sampling layouts.
For a useful diagnostic, record whether a defect is present in the source, the processed image before export, the decoded delivery file, or only one playback environment. That observation narrows the investigation. It does not establish the cause on its own.
Foundations / 03
Why an edge can flash while the body looks stable
A silhouette contains mixed pixels. Motion blur, fine fibres and partial coverage can combine garment and background in the same sample. A simple compositing equation exposes why an unstable boundary can matter even if the two underlying colours stay fixed.
C = αF + (1 − α)B
ΔC = Δα(F − B)                 when F and B are fixed

Toy scalar values in linear light:
F = 0.2, B = 0.9
α = 0.50 → C = 0.55
α = 0.60 → C = 0.48
Change in C = −0.07
Here α describes fractional coverage in an idealised mixture. It is not a claim about the implementation or a diagnosis of every flash. A change in coverage of just 0.10 causes a change of 0.07 in this example because the foreground and background differ strongly. Higher spatial resolution does not automatically remove uncertainty about the transition.
In video, the right question is not whether every edge pixel stays constant. Real motion changes coverage. The question is whether the transition remains coherent with motion and the neighbouring scene. A temporal average can suppress both unwanted flicker and legitimate detail; a lower variation score is therefore insufficient by itself.
The visual atlas / 59 distinct synthetic anchors
Learn to see the failure modes.
Nine chapters, each with a different question.
Meta AI-generated illustrations from the supplied sessions. Descriptions below follow the visible image rather than assuming every generation obeyed its prompt. These are not paired corrections, calibrated material samples or a benchmark dataset.
Visual chapter 01 / Meta AI illustrations
Pale does not mean colourless
Cream, blush, lilac and sage carry identity through small differences. These examples make the distinction between fabric colour, illumination and exposure worth examining. A result that looks clean or neutral can still be a poor match. Inspect broad material regions and fine structure; do not use a bright highlight as a substitute for the whole garment.
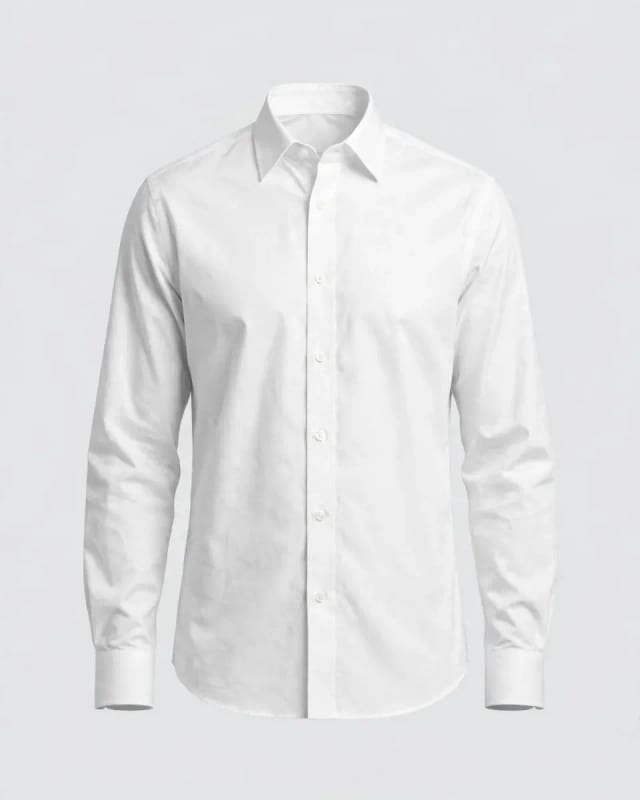
01 / White poplin shirt
White is not a blank pixel. Inspect the shaded sleeve and the illuminated chest separately. A white product needs a tonal range to describe its folds; pushing every region toward display white would erase the weave and silhouette.
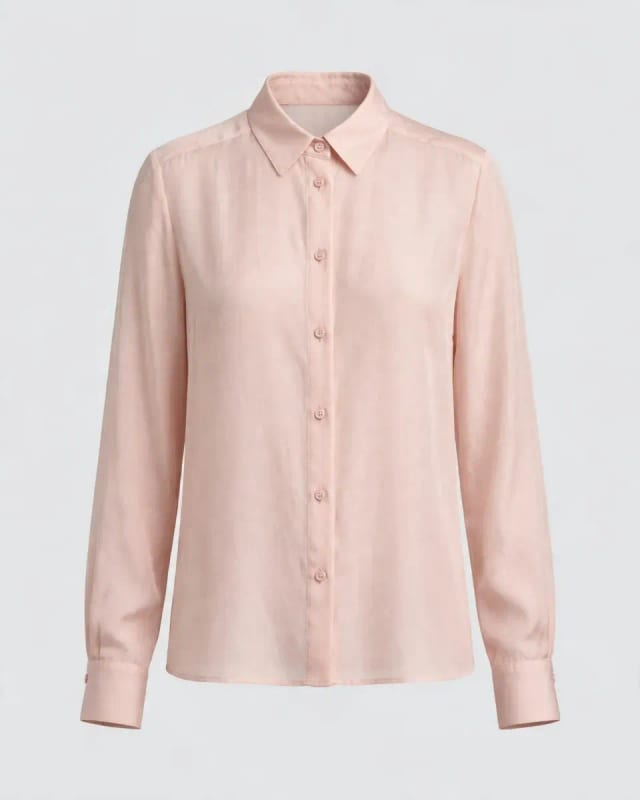
02 / Blush blouse
A small tint can carry the identity. Inspect pinkness in the broad front panel, away from buttons and deep folds. A neutral-looking result might be aesthetically plausible while losing the subtle blush that distinguishes the product.
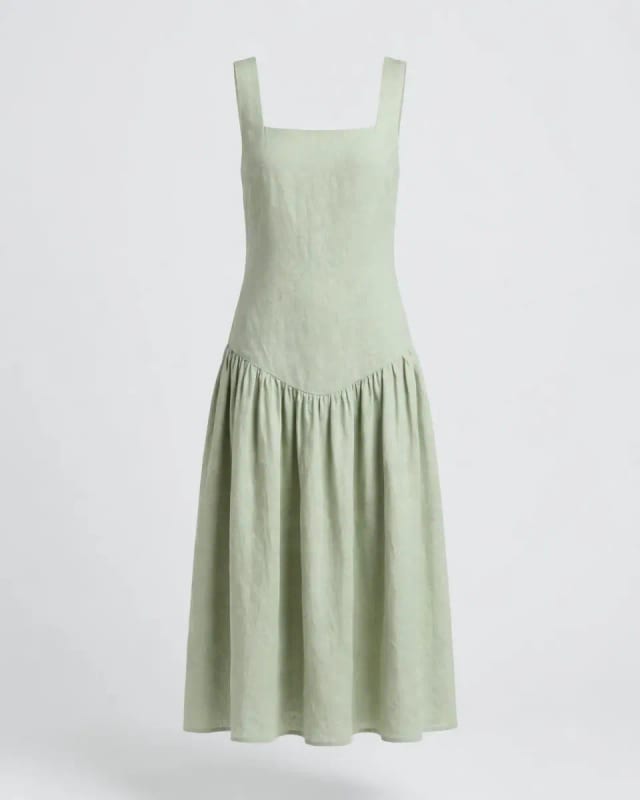
03 / Sage dress
Low saturation is still colour. Look at the green-grey body and the darker gathering at the waist. Increased brightness and reduced saturation can both make sage seem beige, but those are different changes and need separate descriptions.
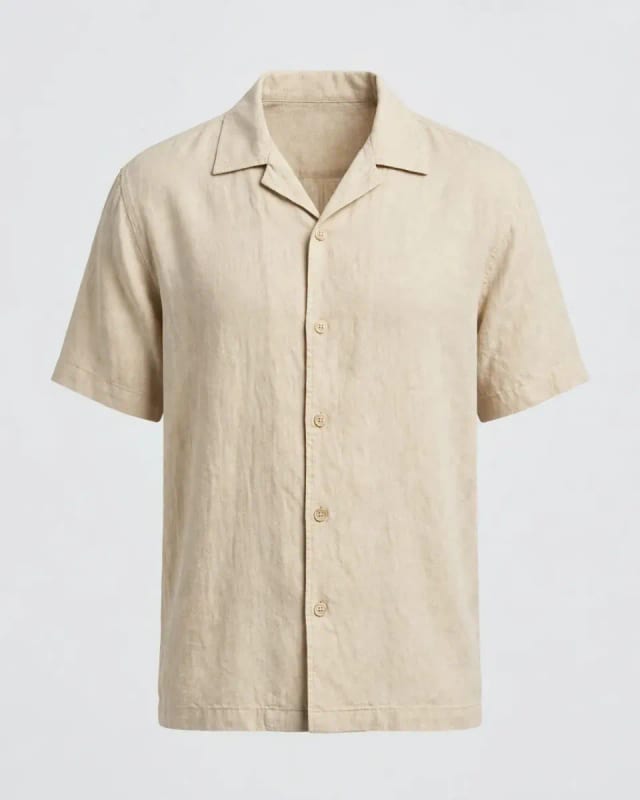
04 / Oat camp shirt
Cream and grey are not interchangeable. Compare the warm body colour with its neutral surroundings. The collar underside should remain darker than the chest; natural shadow is evidence of form, not automatically a colour defect.
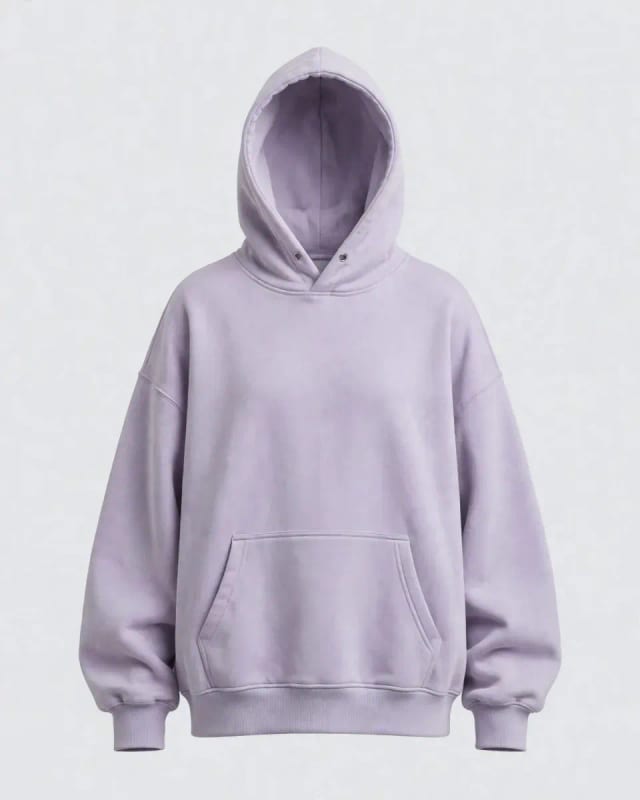
05 / Lilac hoodie
Pastels make small shifts visible. Use the broad body as one observation and the hood interior as another. A correction that makes the body convincing can still introduce a blue or grey cast in the shadows.
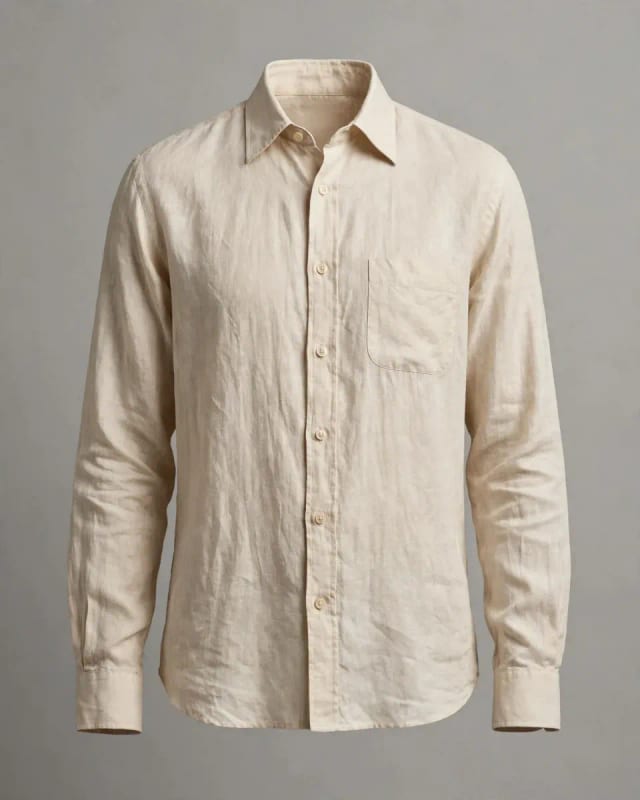
06 / Ecru linen shirt
A neutral reference still has uncertainty. Notice the brighter shoulder and darker lower panel. A single sampled pixel cannot represent the entire fabric, and the photograph cannot establish a physical dye specification.
Visual chapter 02 / Meta AI illustrations
Vivid is not the same as faithful
Saturated products make attractive images, but attractiveness does not certify the requested shade. Hue, chroma and lightness describe different aspects of a change. A dramatic blue-to-red failure is easy to notice; a smaller change from one plausible blue to another can matter just as much to product communication.
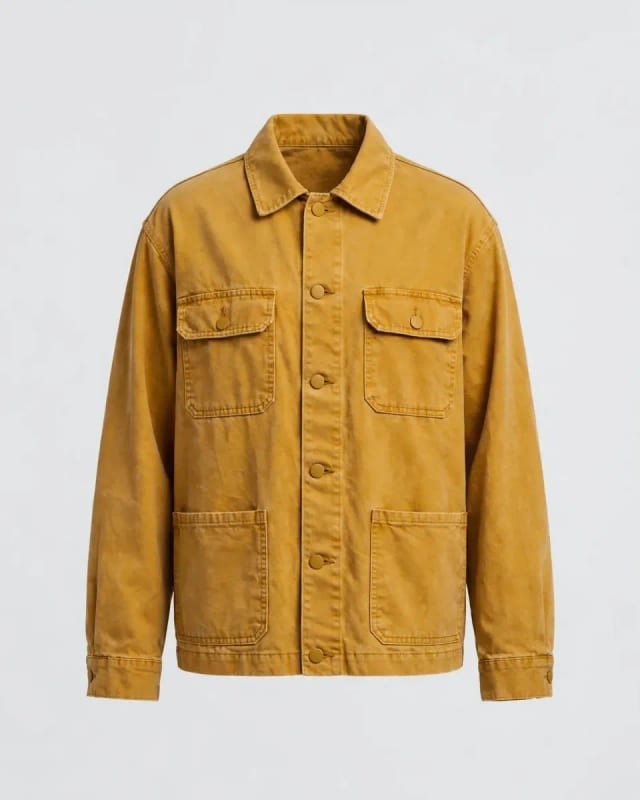
07 / Mustard work jacket
Hue and saturation answer different questions. Inspect whether the yellow reads earthy or lemon-like, then whether it appears muted or vivid. Pocket shadows should not be mistaken for a second fabric colour.
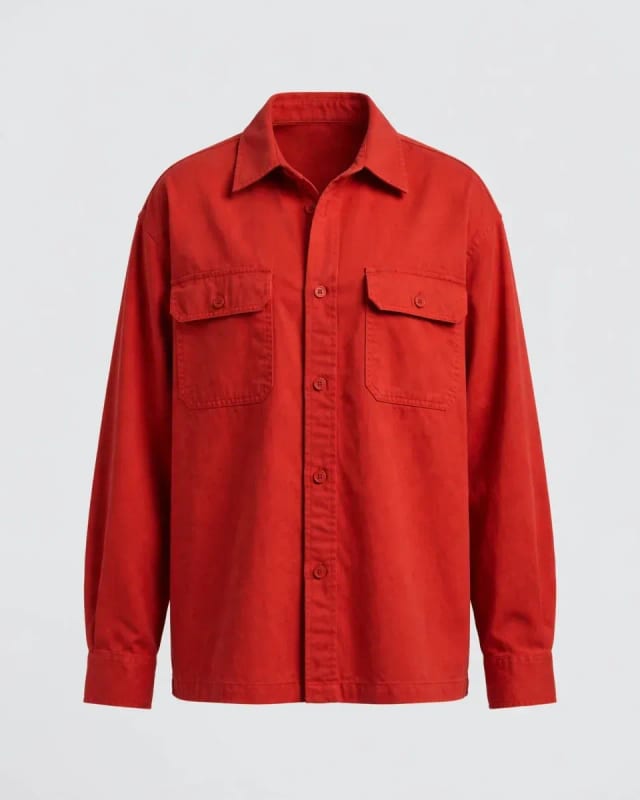
08 / Red overshirt
Channel clipping can conceal differences. Look for detail in the brightest red folds as well as the red hue. A vivid surface that loses highlight texture can look convincingly saturated while discarding product information.
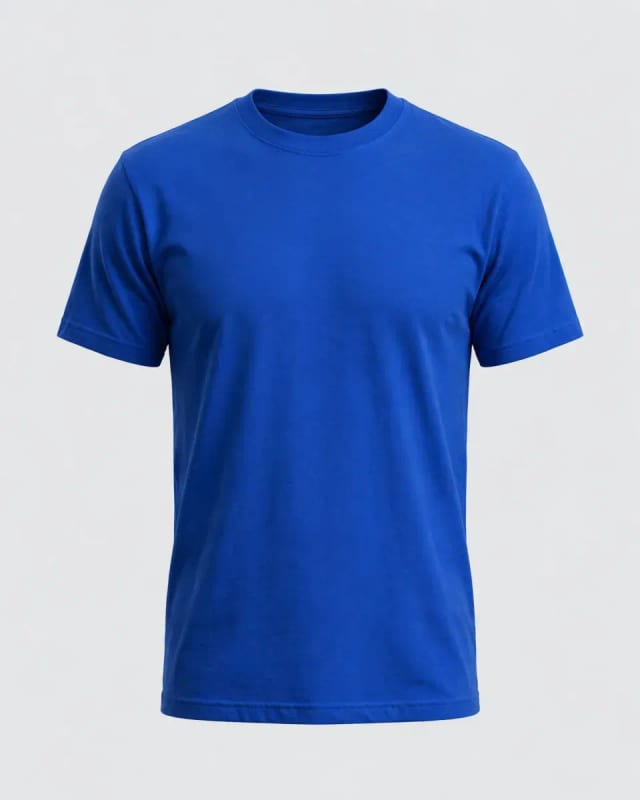
09 / Blue crewneck tee
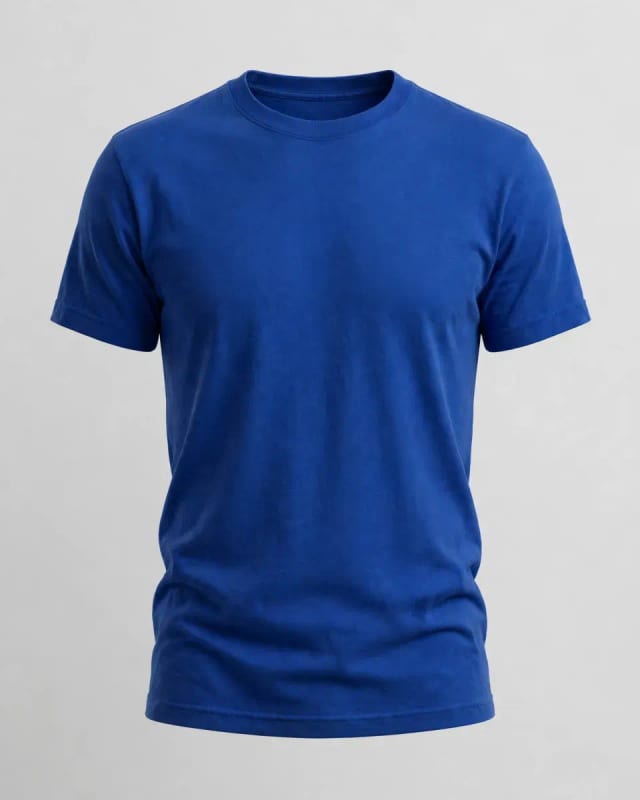
A familiar colour name is too broad. Cobalt, royal blue and indigo occupy different appearances. Use the image as a visual anchor; a prompt saying blue is not a numerical constraint on the delivered pixels.
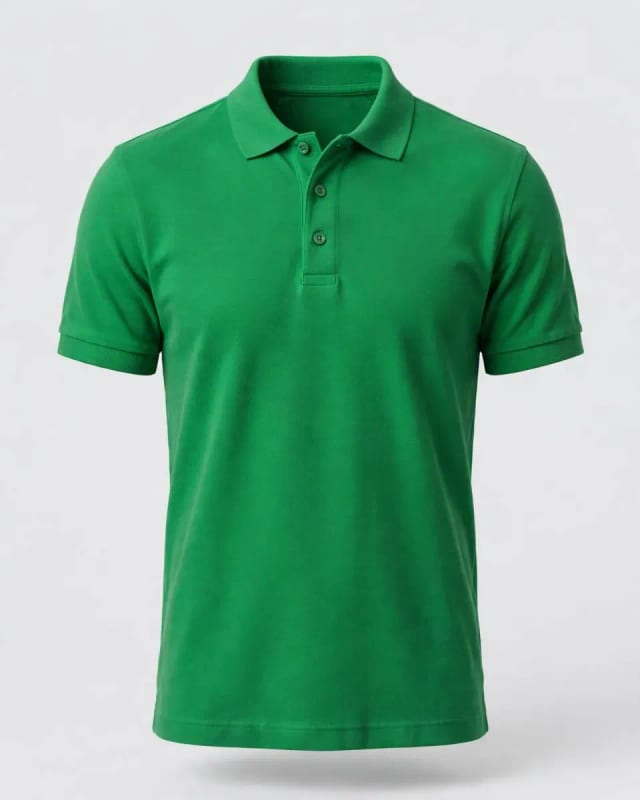
10 / Green knit polo
Vivid colour needs texture as well. Inspect the knit and placket as well as the green body. Increasing chroma globally can make the colour more striking while changing the collar, edge pixels and local contrast.
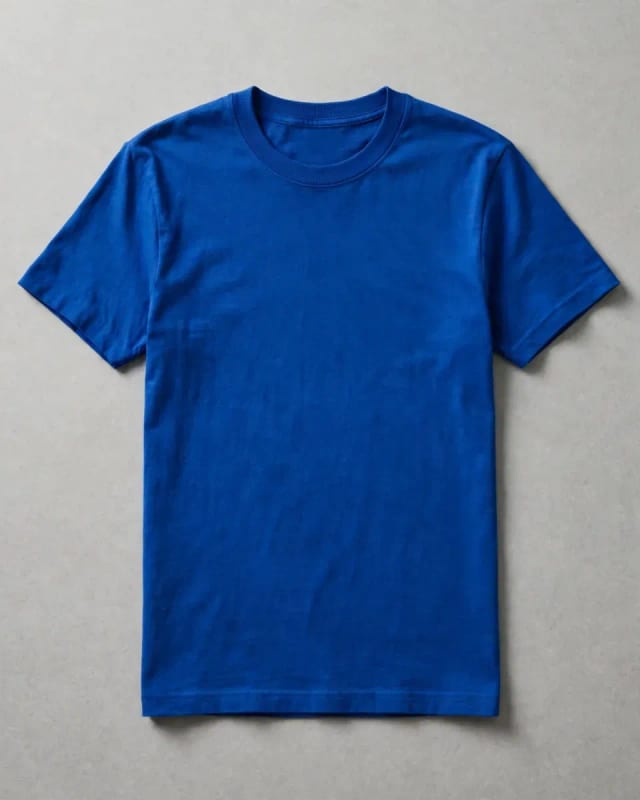
11 / Blue flat-lay tee
Layout changes the visible evidence. Wrinkles, surface orientation and shadows differ from a mannequin view. This is a separate generated illustration, not a paired output of the other blue tee in this guide.
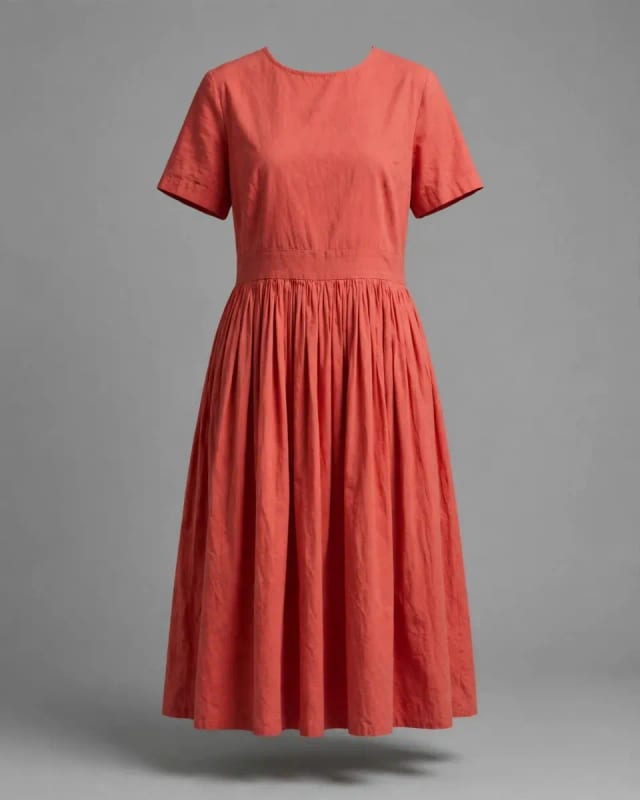
12 / Coral dress
Red-orange drift is easy to misname. Inspect the broad skirt between folds. A warmer appearance can come from a hue shift or scene illumination; the still image alone does not identify the cause.
Visual chapter 03 / Meta AI illustrations
Dark materials hide two kinds of failure
A dark garment can lose its colour identity by becoming too neutral, or lose its construction by becoming too flat. The absence of conspicuous variation is not enough. Inspect lapels, ribbing, seams and directional fibres as well as the broad material shade. These are separate illustrations, not controlled repetitions of one object.
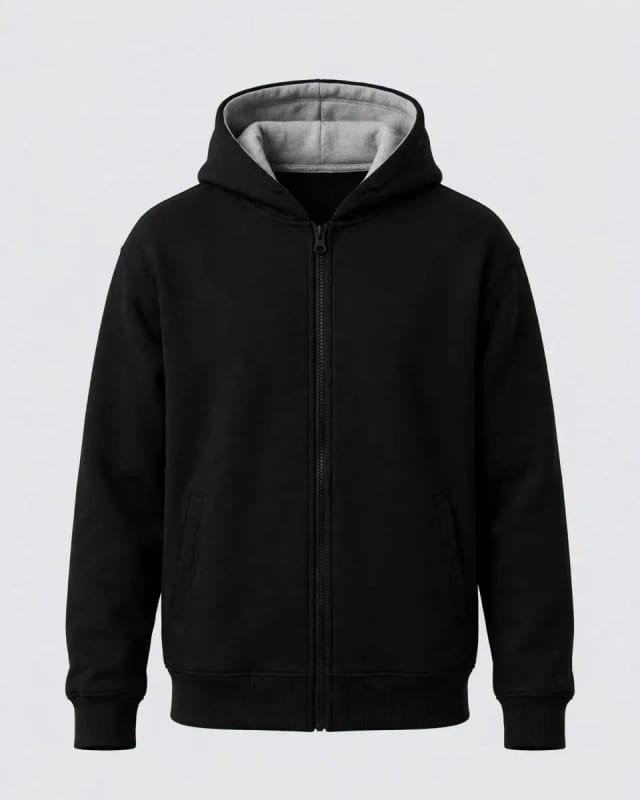
13 / Black zip hoodie
Black fabric must retain structure. Inspect the zip, cuffs and hood lining. Matching only a very low average brightness could hide crushed detail, while lifting every shadow may make black look washed out.
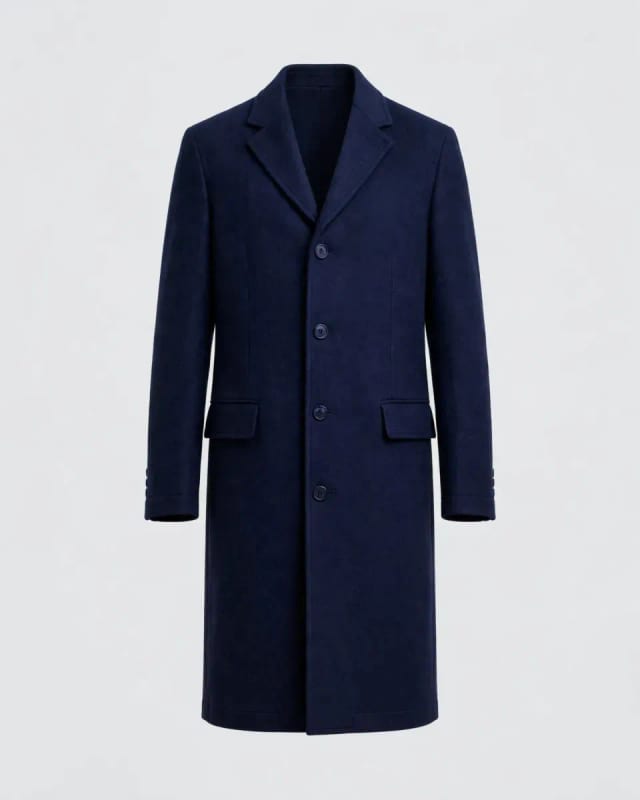
14 / Navy coat
Navy should not collapse into black. Look for the blue character in the front panels without requiring identical brightness across lapels. Dark materials challenge both colour judgement and visibility of construction details.
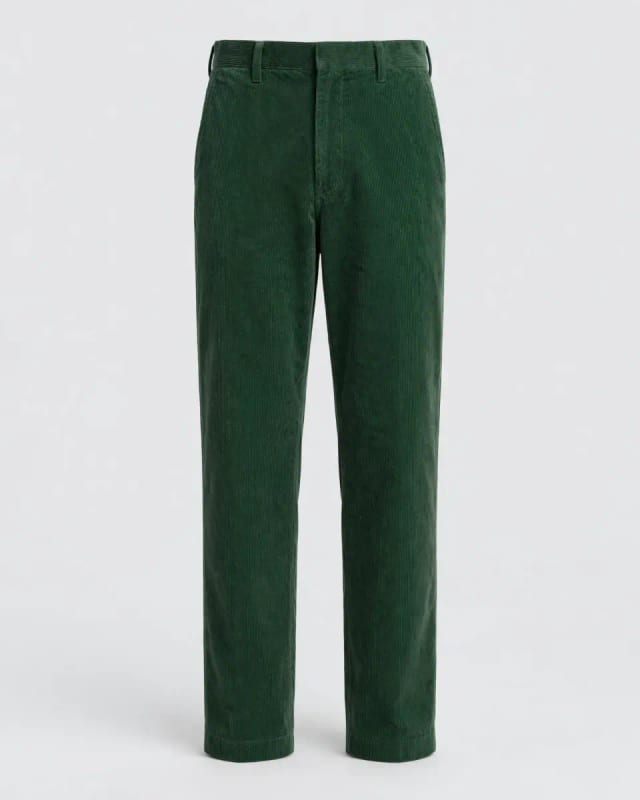
15 / Green corduroy trousers
Directional texture complicates sampling. The ridges create local light and dark bands. A measurement over a ridge peak is not interchangeable with one in its valley, even though both belong to the same textile.
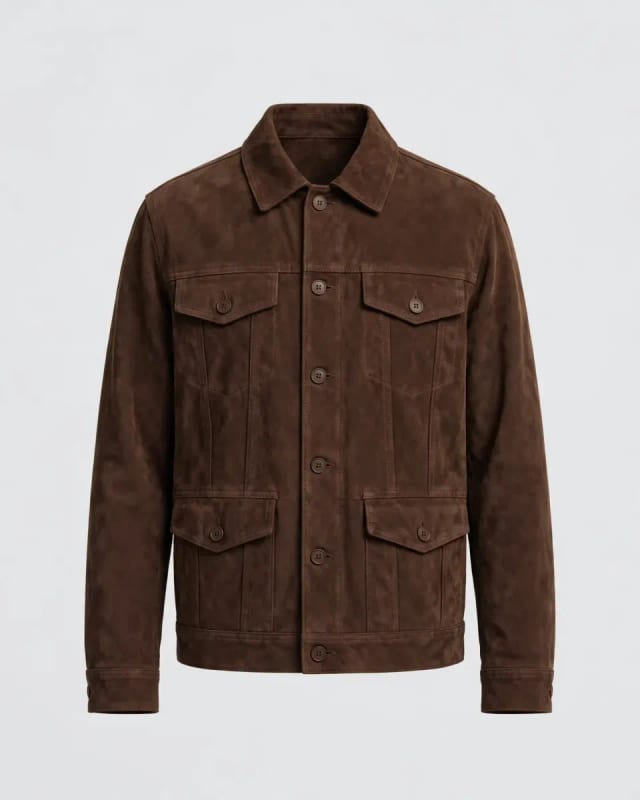
16 / Brown suede jacket
Material and colour cannot be judged independently. The soft, uneven surface contributes to perceived brownness. Removing all local variation could preserve a broad shade while destroying the visual cues that make it look like suede.
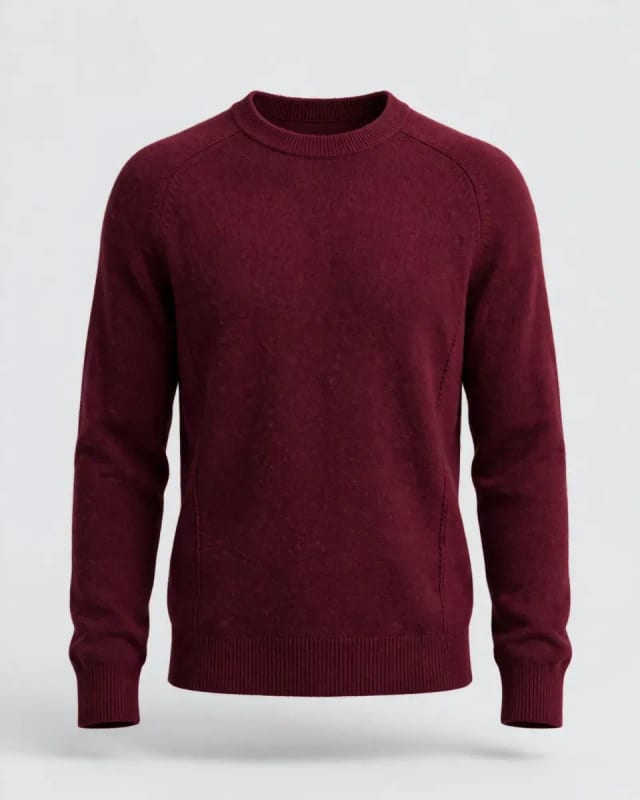
17 / Burgundy sweater
Dark red is not simply dim bright red. Inspect the chest, sleeves and ribbed hem. A useful comparison asks whether the maroon character and the knit remain plausible across differently lit parts of the garment.
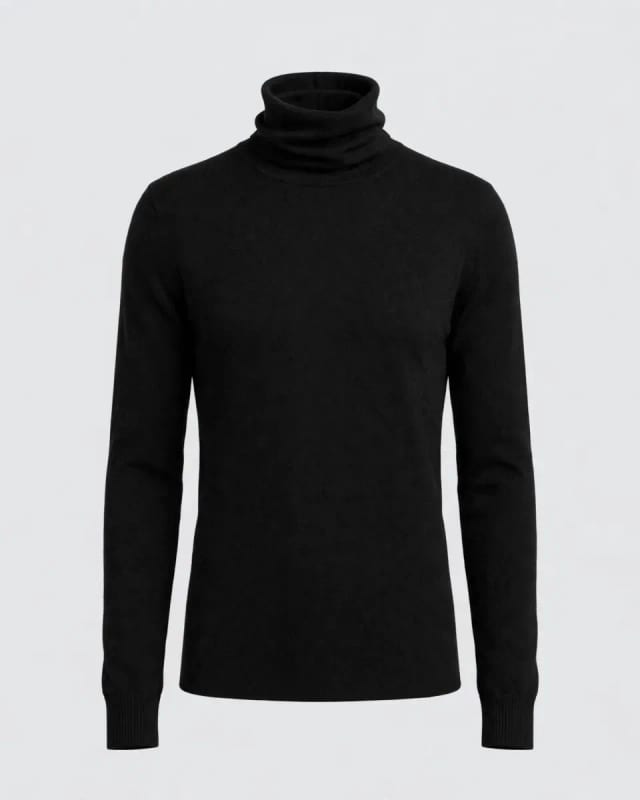
18 / Black turtleneck
A stable average can hide a flat surface. The silhouette is clear, but fine detail is subtle. Colour fidelity cannot be inferred from the absence of visible noise; a low-detail black result may merely be difficult to evaluate.
Visual chapter 04 / Meta AI illustrations
A garment is not one colour distribution
Prints and embroidery make the limits of global statistics visible. A collection of colour values does not specify where those values belong. Motifs can move, disappear or change scale while an overall palette remains similar. Check identity and spatial arrangement before interpreting a colour score.
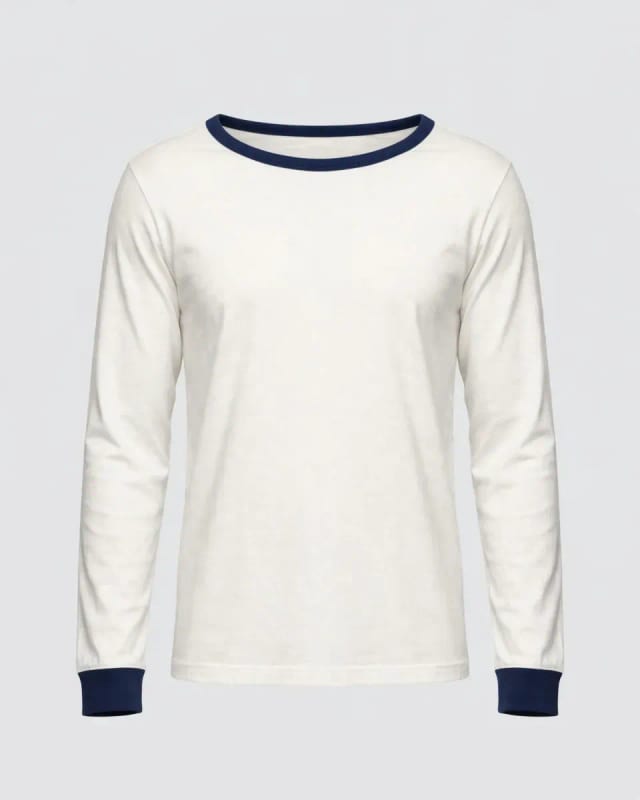
19 / Cream top with navy trim
The requested pattern is not guaranteed. This supplied image visibly shows a mostly plain body with dark trim. The intended striped concept was not fully realised. It illustrates why prompt compliance must be checked before building a benchmark.
20 / Red gingham shirt
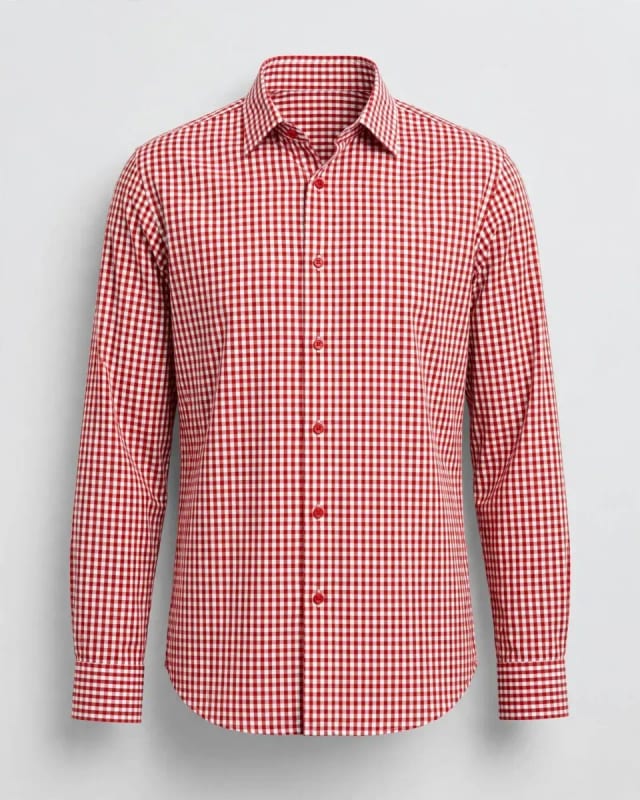
Pattern scale changes the colour mixture. At thumbnail size, red and white checks visually blend. Evaluate individual checks at sufficient resolution as well as the overall appearance; a global average cannot establish pattern preservation.
21 / Blue motif shirt
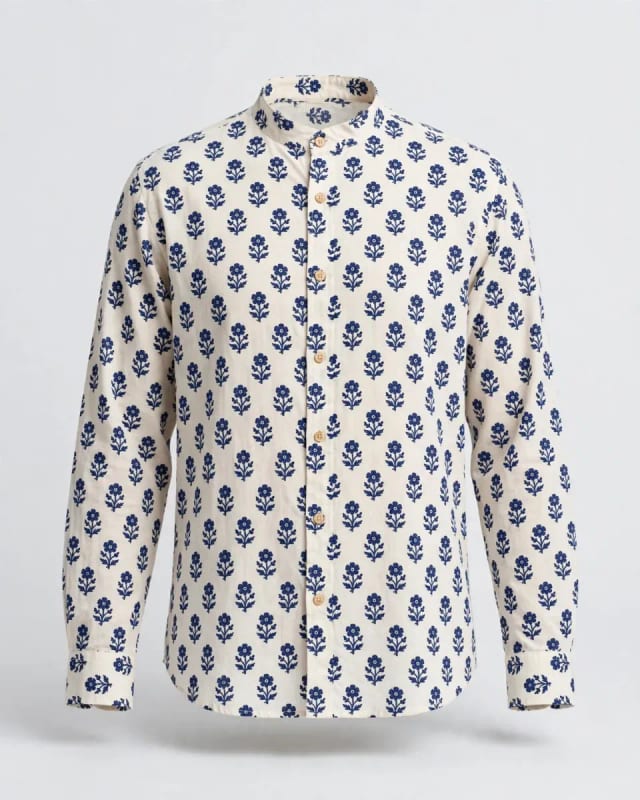
Small motifs can disappear into averages. Inspect blue elements, light ground and spacing separately. The aggregate may remain similar even if some motifs blur, shrink or change shape.
22 / Cream shirt with violet embroidery
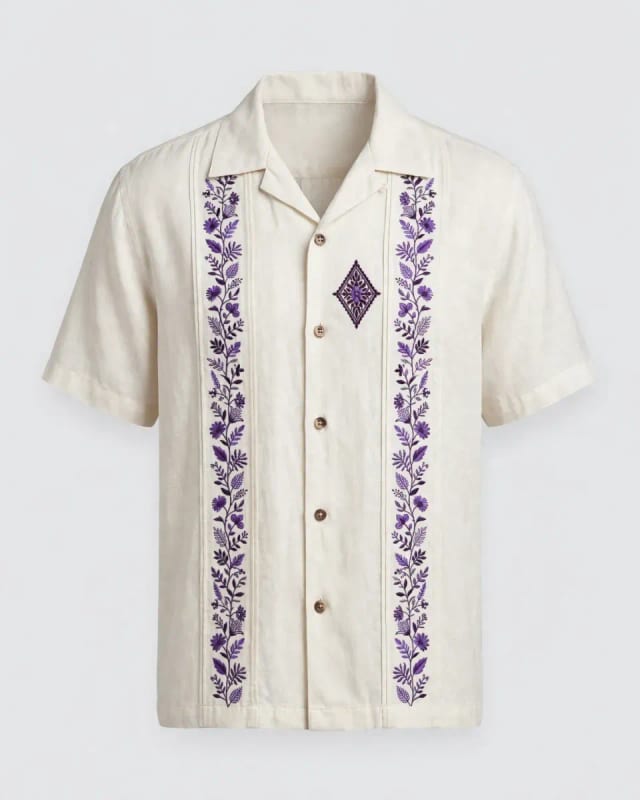
One garment can contain several colour targets. The pale fabric, dark thread and tiny stitch highlights are different evidence. A fabric-only judgement can pass a result whose embroidery has shifted or lost its fine boundaries.
23 / Multicolour spiral tee
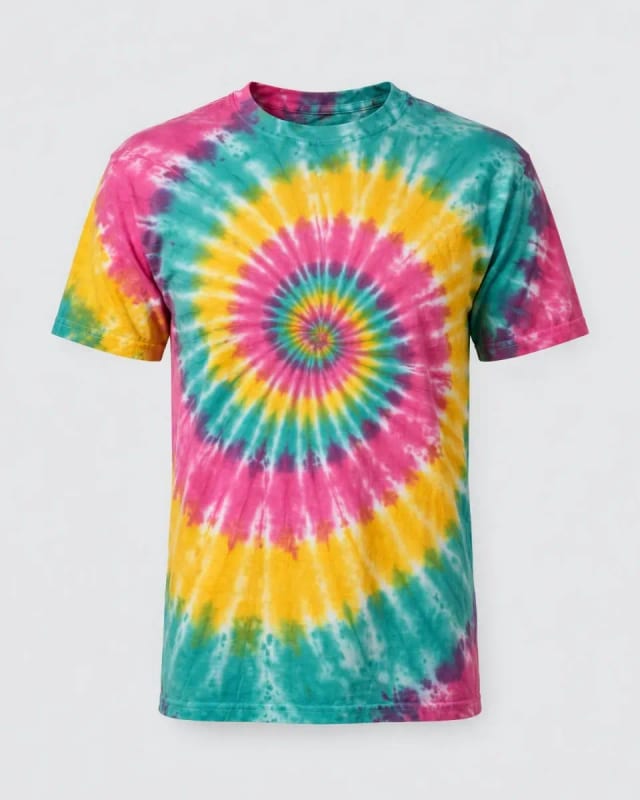
A similar palette does not certify placement. Inspect the relative positions and continuity of the coloured rings. Matching a histogram could leave the same collection of colours in entirely different locations.
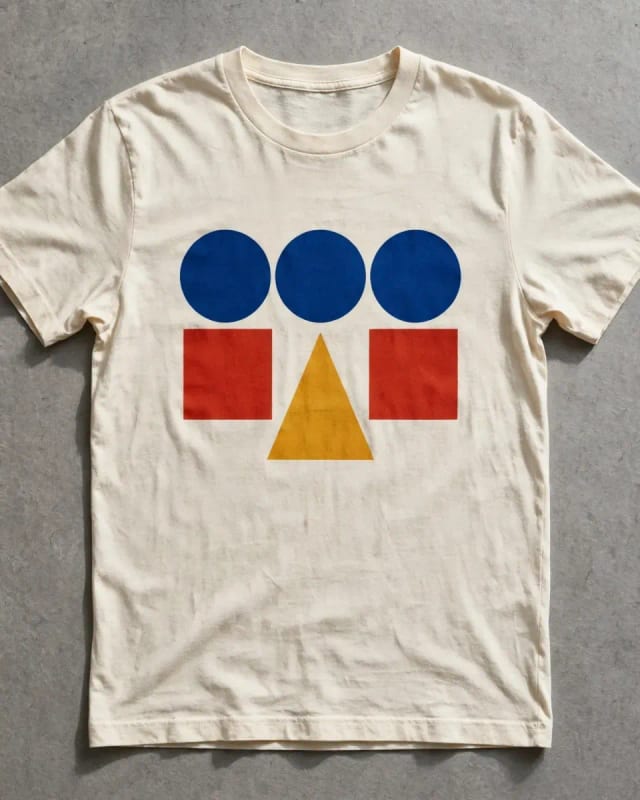
24 / Geometric print tee
Count and arrangement matter alongside colour. The blue circles, red blocks and yellow triangle offer clear landmarks. A useful assessment checks their number, shape and position, not only their average chromaticity.
Visual chapter 05 / Meta AI illustrations
Texture gives colour a physical context
Cable knit, linen, denim, quilting and fine fibres create appearance at different spatial scales. Broad shadows communicate form; smaller structures communicate material. Making every patch equally bright may reduce one kind of variation while removing both. The useful objective is coherent appearance, not uniform colour.
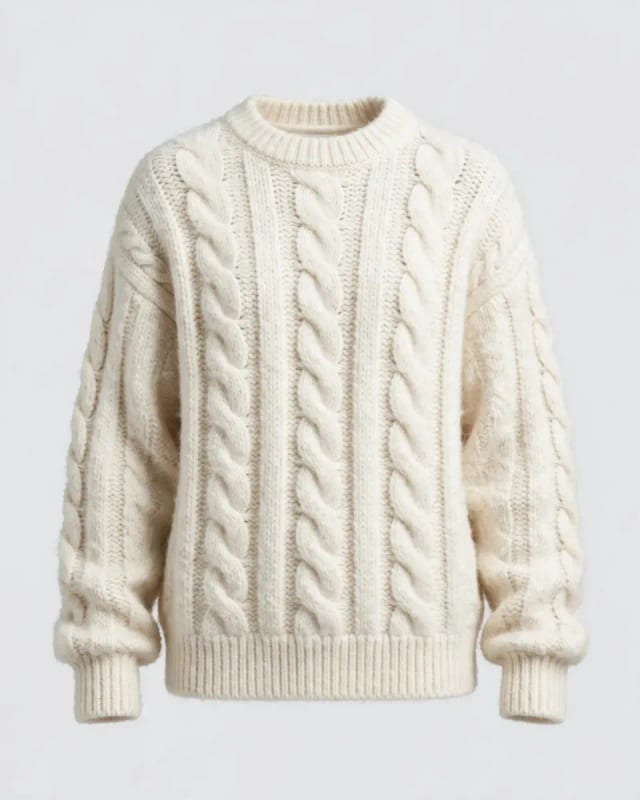
25 / Ivory cable-knit sweater
Relief creates legitimate brightness variation. Raised cables and recessed stitches receive different illumination. Flattening that variation to minimise a colour-distance score would remove evidence of the construction.
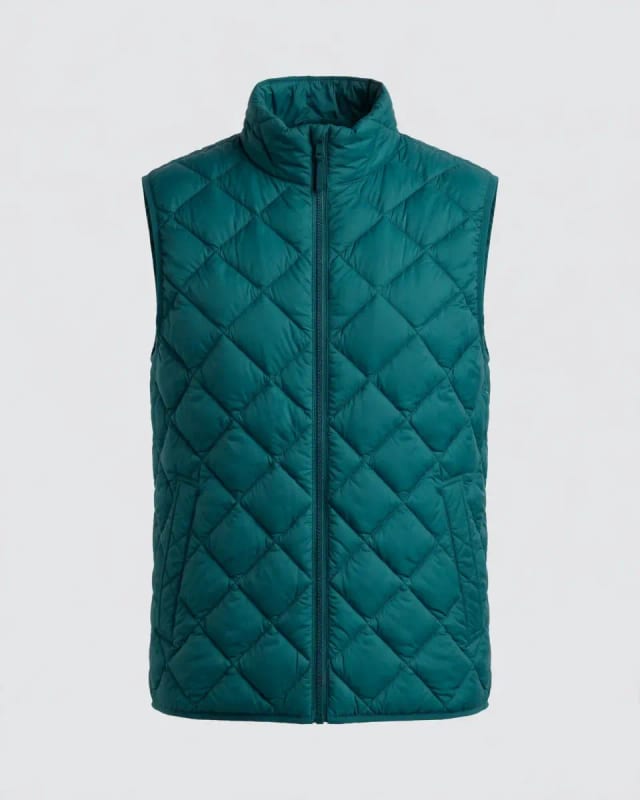
26 / Teal quilted vest
Repeated panels expose local inconsistencies. Inspect adjacent diamond panels under similar light. Some contrast describes puffed geometry; an isolated panel changing hue would raise a different concern.
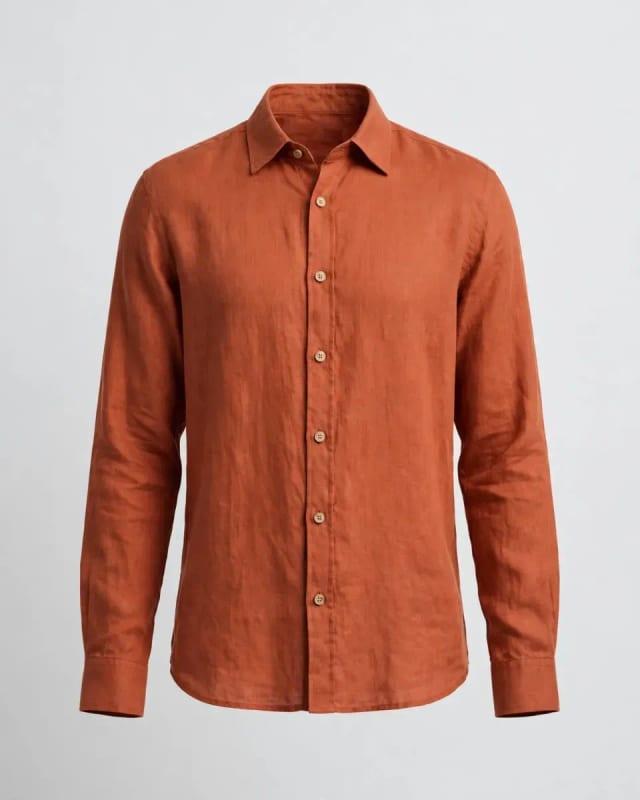
27 / Terracotta linen shirt
Fine weave and broad folds live at different scales. Look at the seam edges and broad chest panel independently. A result can retain its orange-brown family while losing the smaller-scale texture that describes the fabric.
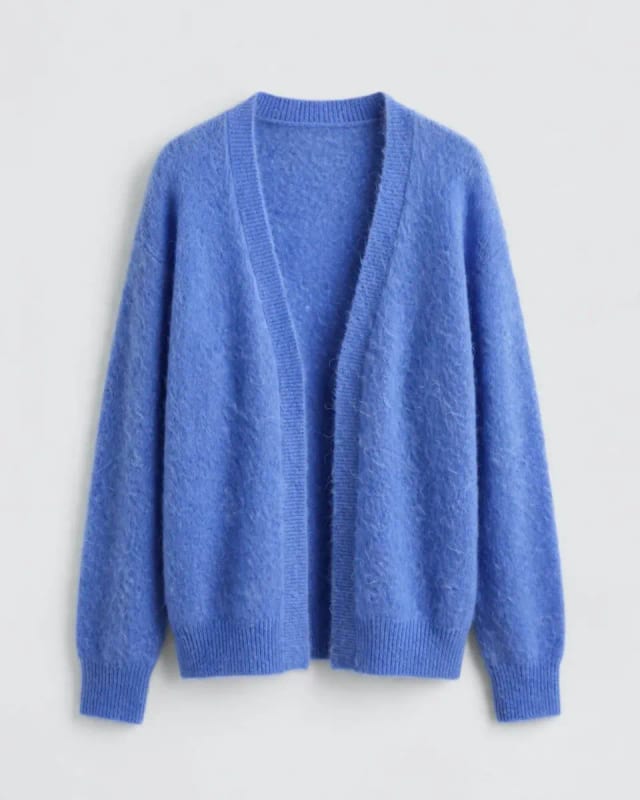
28 / Blue fuzzy cardigan
Fibres complicate the silhouette. Fine hairs blend with the background at the edge. An apparently clean outline can be the result of removing those fibres rather than preserving them.
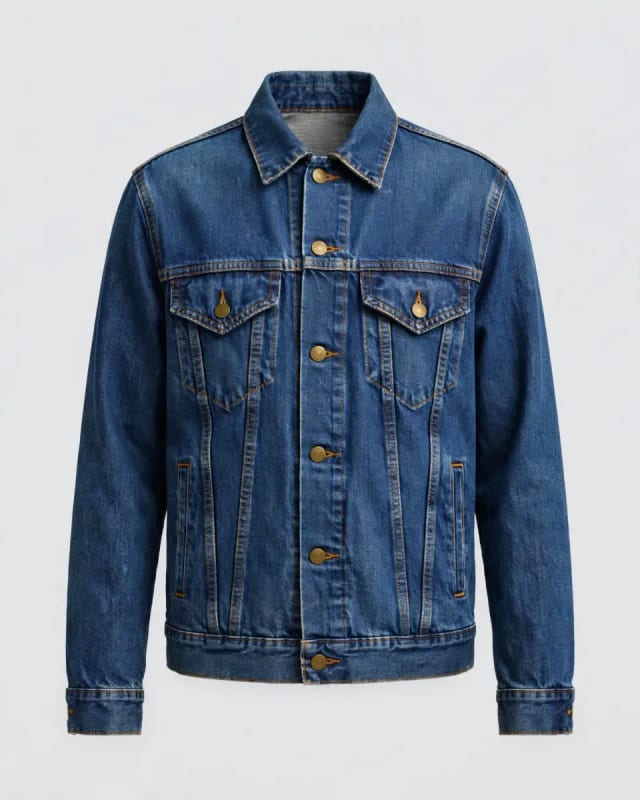
29 / Denim jacket with warm stitching
Secondary details deserve their own check. Inspect stitching and hardware separately from indigo panels. A single adjustment that helps the denim can unintentionally desaturate or recolour the contrasting thread.
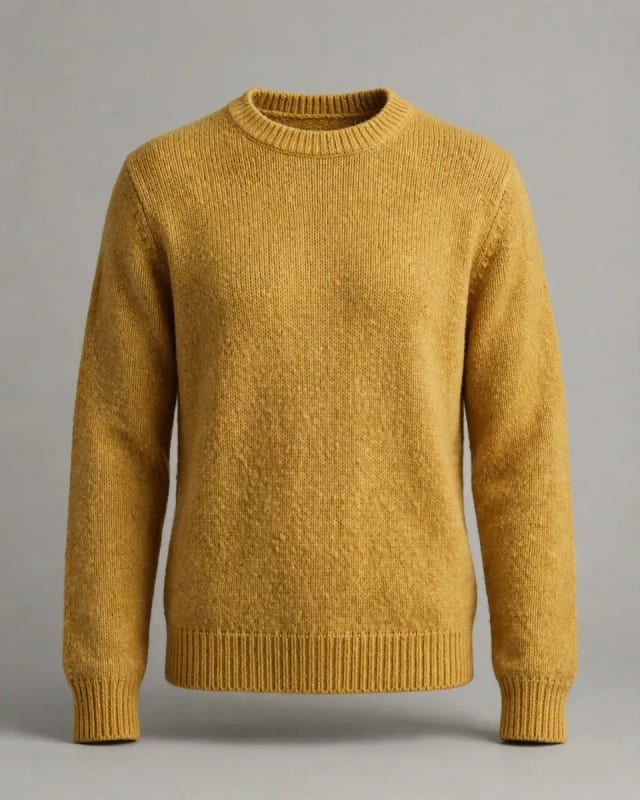
30 / Mustard knit sweater
Texture is not just random variation. Follow the repeated knit pattern. Over-smoothing may reduce fluctuations in a metric while also making the textile less credible at viewing size.
Visual chapter 06 / Meta AI illustrations
The colour moves with the light
Satin, velvet, sequins and sheer cloth are difficult precisely because their appearance should change. A highlight passing over satin is not the same event as a random flash at an outline. These still illustrations show the appearance categories; they cannot establish temporal behaviour or identify a flicker cause.
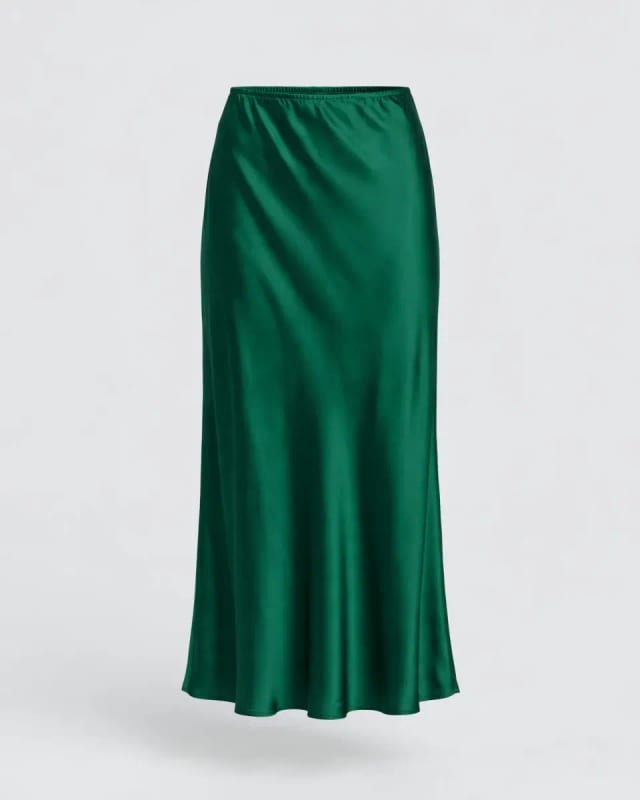
31 / Emerald satin skirt
A highlight is not the base colour. The long bright and dark folds communicate sheen. Expect a highlight to move with viewpoint; demanding identical pixels across rotation would contradict this appearance.
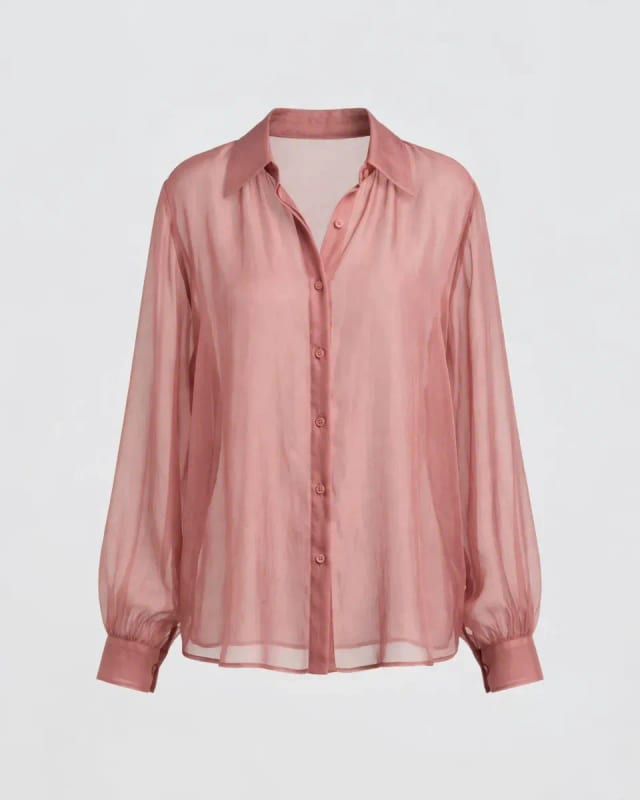
32 / Dusty-rose sheer blouse
Transmission brings other surfaces into view. The sleeves and body differ in opacity and layering. A visible colour may include what is behind the cloth, so the same material need not have one observed RGB value.
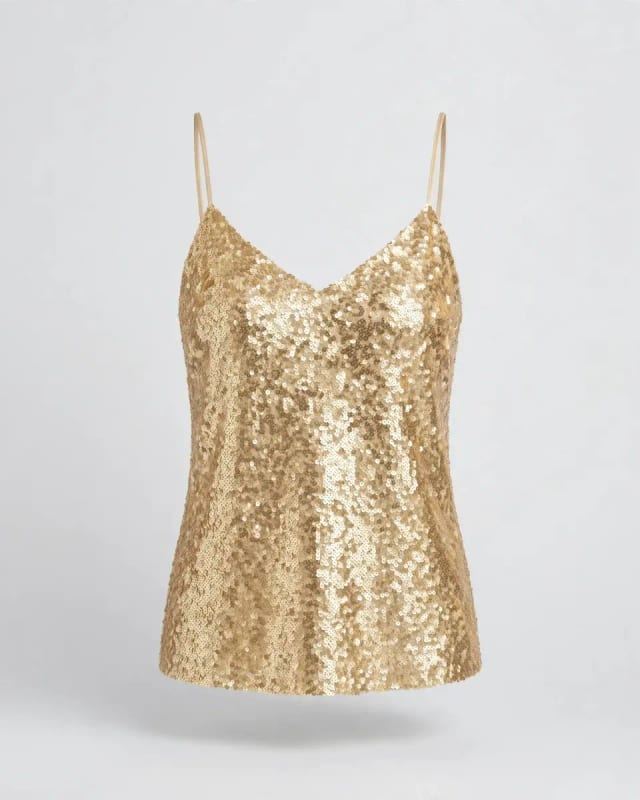
33 / Champagne sequin top
Tiny bright regions can dominate attention. Inspect whether highlights remain attached to a plausible sequin pattern. Random flashes and physically plausible sparkle may look similar in a single frame; a sequence is needed to distinguish them.
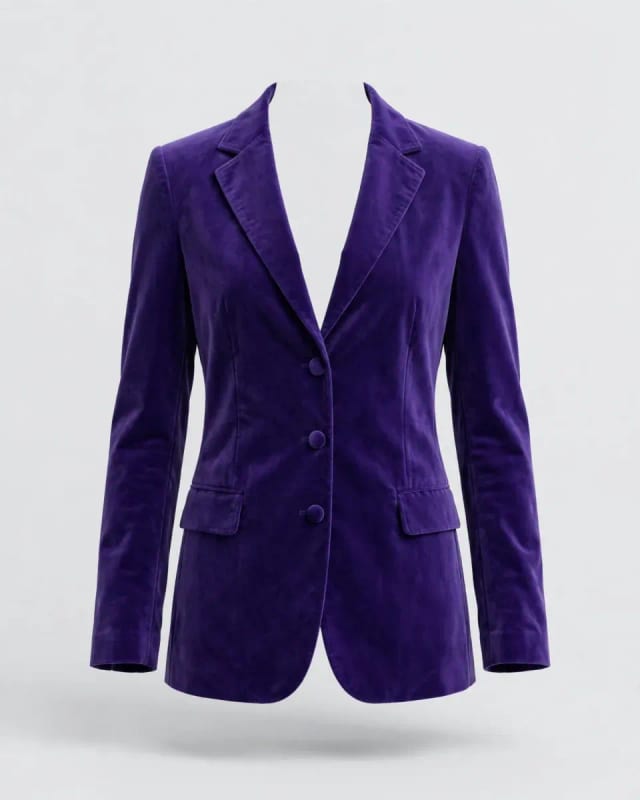
34 / Purple velvet blazer
Pile direction changes apparent depth. The lapels and front panels show different tonal character. That contrast does not by itself prove colour drift, because directional surface appearance is part of the material.
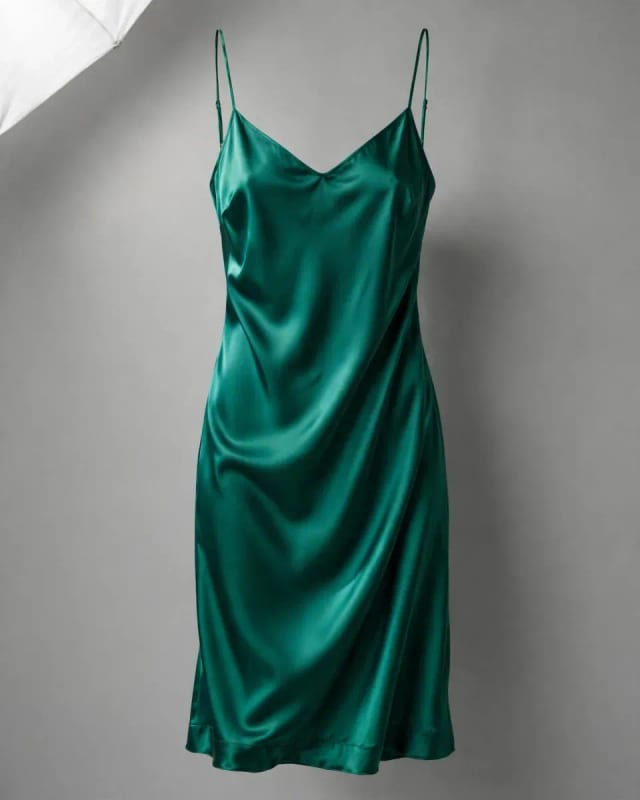
35 / Teal satin dress
Shading must remain compatible with form. Inspect the folds rather than only a central swatch. A uniform colour fill could reduce variation and simultaneously erase the evidence of satin.
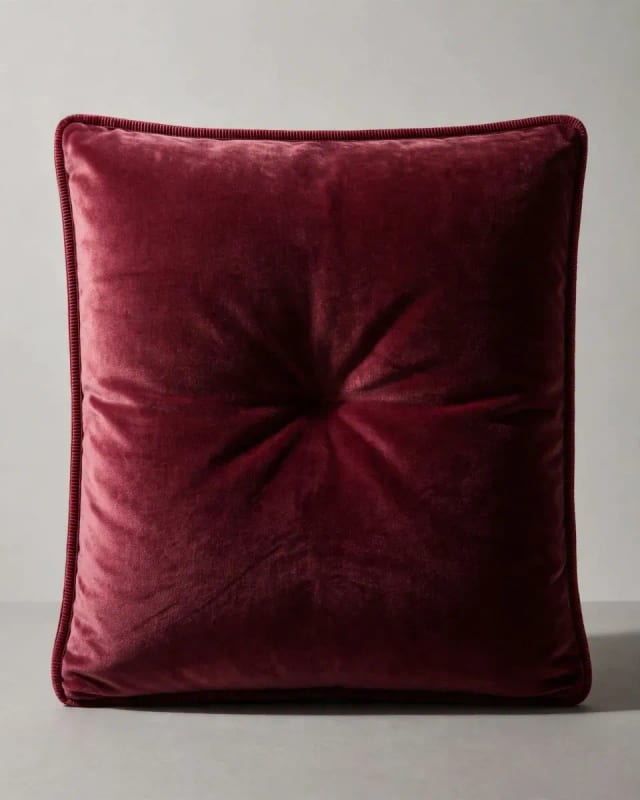
36 / Burgundy velvet cushion
Object geometry changes the comparison. The centre indentation, edges and broad faces have different orientations. Comparing the darkest crease to a flat fabric patch would confound geometry with material appearance.
Visual chapter 07 / Meta AI illustrations
The problem extends beyond shirts
Bags, shoes, bottles and cups broaden the discussion to multiple materials, reflection and transmission. They do not establish that the garment workflow supports those categories. A material boundary or a transparent region changes what an observed pixel represents, and therefore changes what a fair comparison would need.

37 / Oxblood and blush handbag
Multiple materials require multiple judgements. Inspect the dark body, pale inset, handles and fittings separately. Their colours occupy unequal areas, so the largest region can dominate an overall statistic.

38 / Ivory shoe with green panel
Boundaries join distinct materials. Leather-like upper, suede-like panel and gum sole should retain separate identities. Colour spill at their junctions can be visible even when each large interior seems correct.
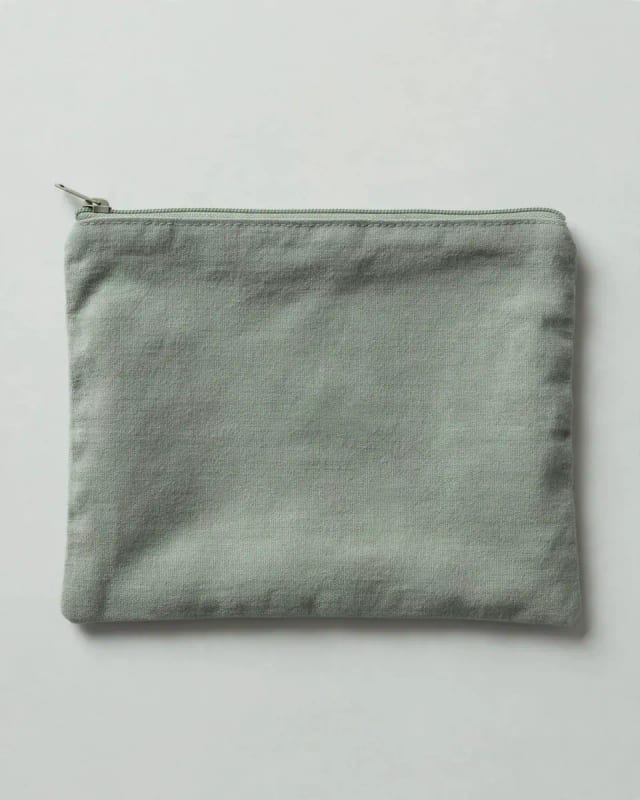
39 / Sage fabric pouch
A simple product can still be ambiguous. The flat face is useful for inspection, but soft shadows and textured edges remain. A neutral backdrop reduces distractions without providing a calibrated colour reference.
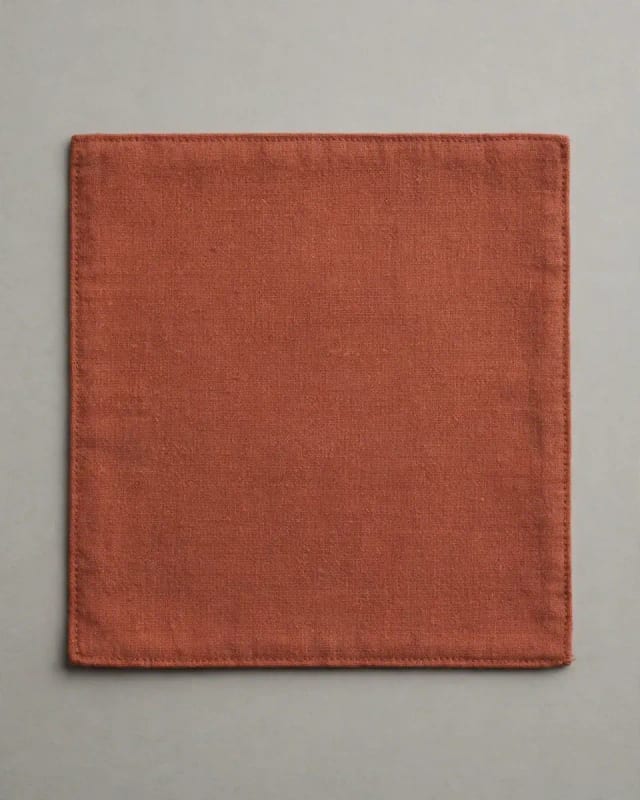
40 / Terracotta fabric square
A flat sample simplifies only part of the problem. A broad visible surface reduces pose ambiguity. It still carries illumination, camera and display assumptions; it is not a substitute for spectral reflectance data.

41 / Amber transparent bottle
The observed colour includes transmission. Look through the bottle as well as at its edges and highlights. The background and optical path contribute to the amber appearance, so opaque-fabric assumptions would be inappropriate.

42 / Copper-coloured travel cup
Reflections can carry the environment. The bright vertical streak is visually different from the darker body. This illustration is useful for discussing reflection, but it does not establish the object's real composition or measured reflectance.
Visual chapter 08 / Meta AI illustrations
The smallest regions can be the loudest
A mesh hole, loose fibre, sleeve outline or occluding arm changes the meaning of a product region. These examples make spatial support part of the question. A visually stable garment interior is compatible with a distracting edge defect. For any eventual motion test, inspect the silhouette and neighbouring scene through the whole turn.
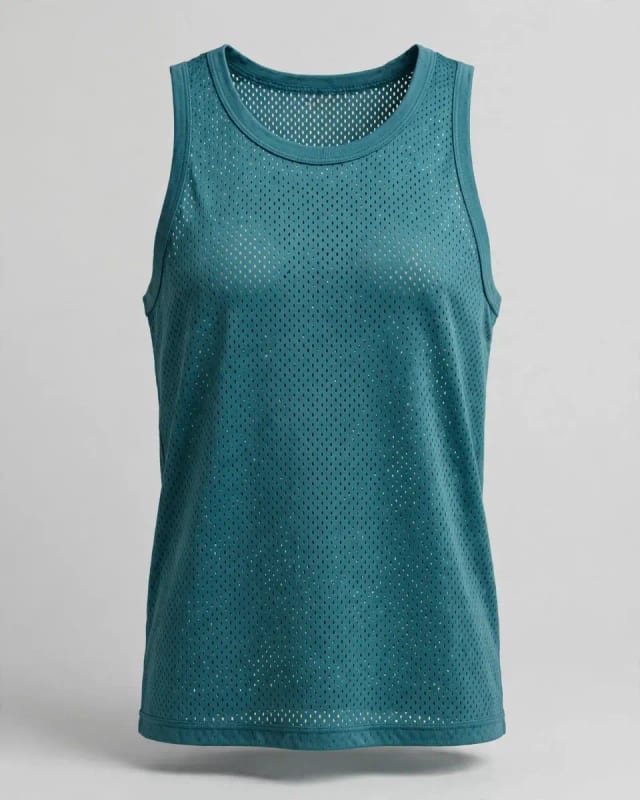
43 / Teal mesh top
Holes are not ordinary foreground pixels. The background is visible through the mesh. Treating the whole silhouette as opaque would alter the holes; treating every pale pixel as background would damage the material.
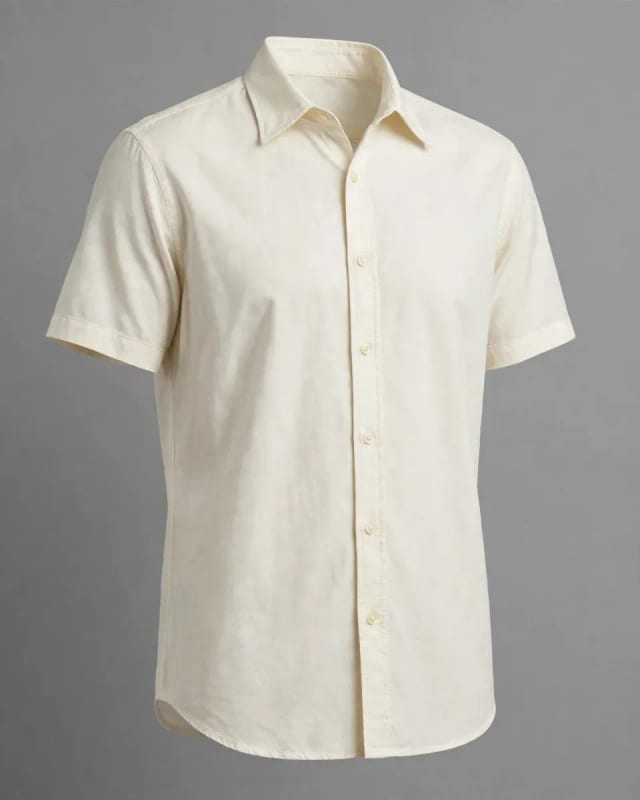
44 / Plain light camp shirt
Low contrast makes the contour important. Inspect the shoulder and sleeve ends against the light background. Small edge changes can be more noticeable in motion than in a static overview.
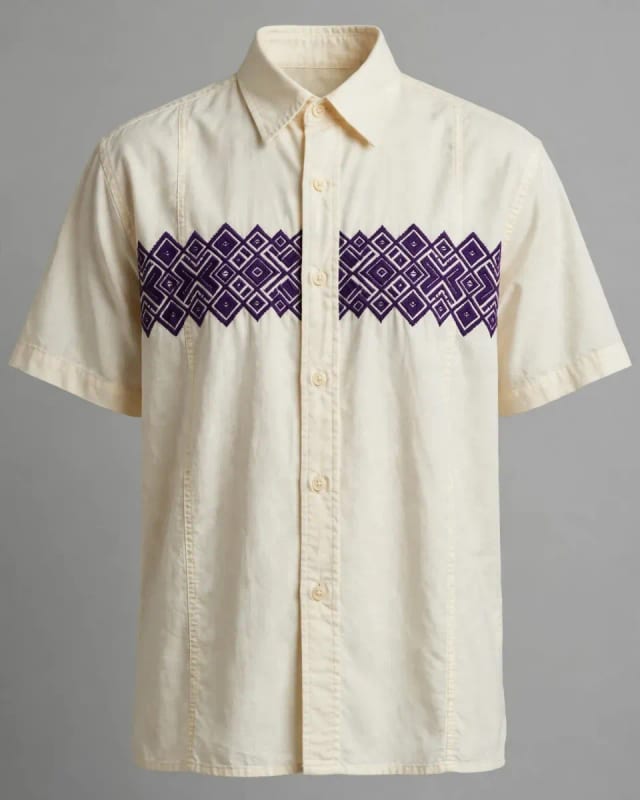
45 / Cream shirt with chest embroidery
A print can approach a fold or edge. Inspect where the purple band meets the placket and creases. Colour transfer alone cannot guarantee that the motifs remain attached to the same garment structure.
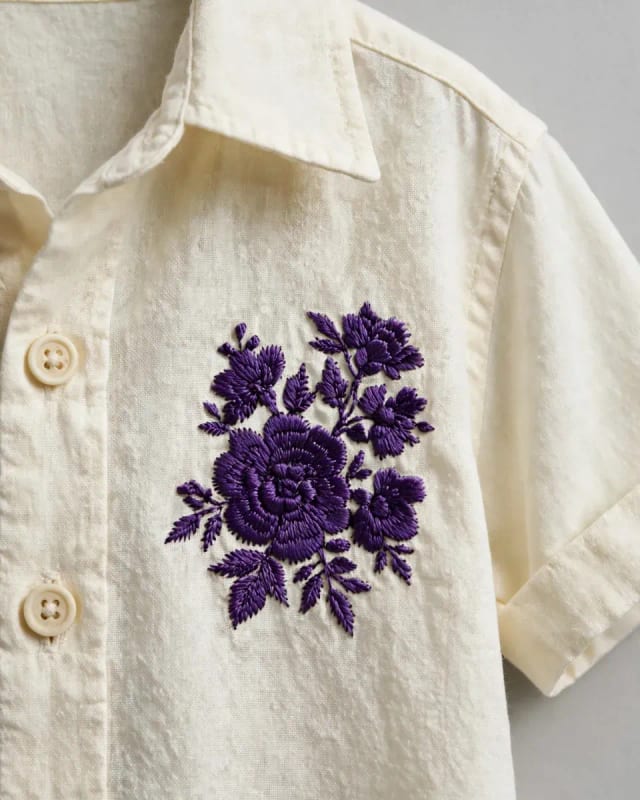
46 / Violet embroidery close-up
Magnification reveals different failures. Use this illustration to look at stitch separation and the fabric around the motif. A pleasing thumbnail is not evidence that fine thread boundaries survived processing.

47 / Olive shirt with an occluding arm
Visibility changes what can be evaluated. The arm covers part of the shirt and introduces a neighbouring surface. A faithful result must preserve skin and background as well as the visible garment; hidden regions are not directly observable here.
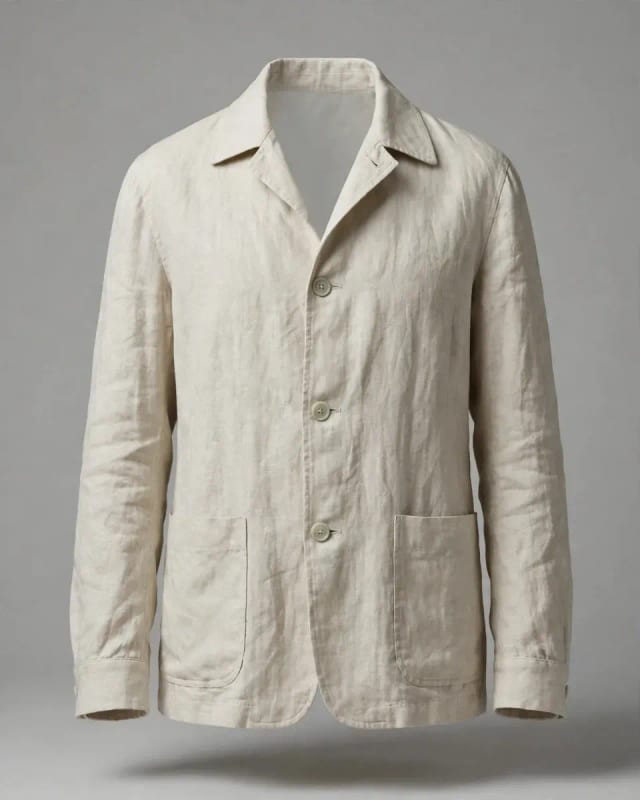
48 / Light textured long-sleeve shirt
An outline is a transition, not a hard truth. Look at the shoulder and lower hem. Mixed edge pixels, fine fibres and shadow all complicate a binary garment/background interpretation.
Visual chapter 09 / Meta AI illustrations
Design the test before announcing the result
The remaining examples are useful anchors for questions about framing, reference uncertainty, lifestyle context and repeatability. They are not additional successful corrections. A strong study distinguishes independent products, repeated generations and adjacent frames, then asks what evidence each actually contributes.
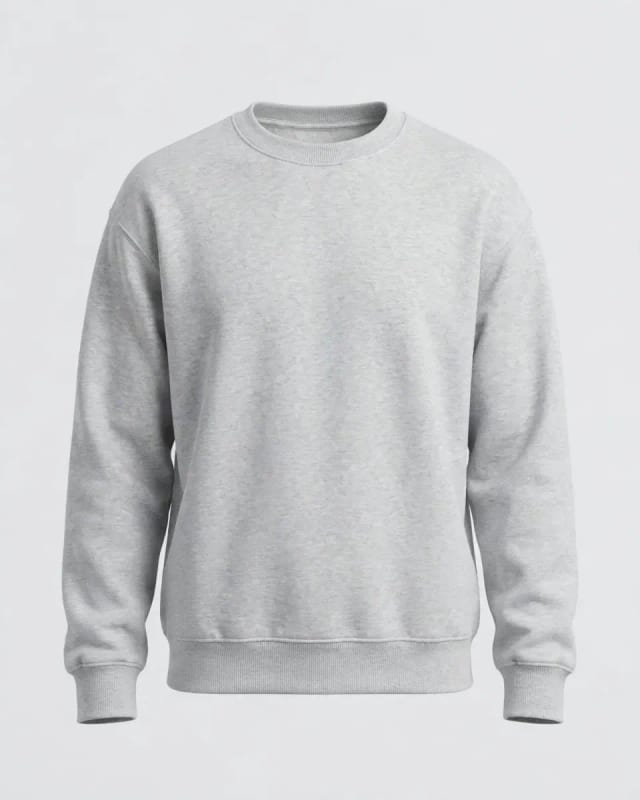
49 / Grey marl sweatshirt
Neutrality and texture must coexist. A neutral mean does not tell us whether flecked yarn, ribbing and folds remain. Inspect local structure before interpreting a low average chromatic error as success.
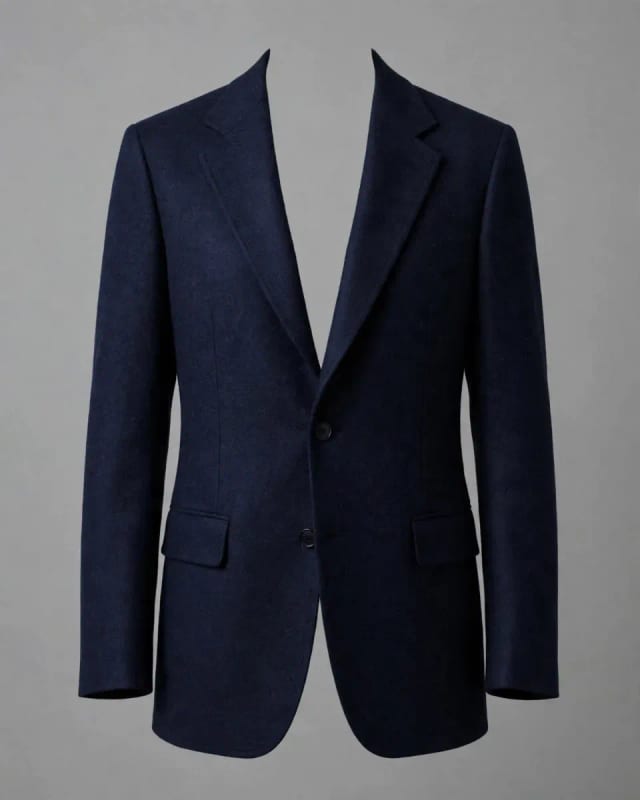
50 / Navy blazer
A second dark example is not a repeat trial. This illustration differs in cut and framing from the navy coat. They broaden the visual discussion but cannot be counted as a matched A/B experiment.
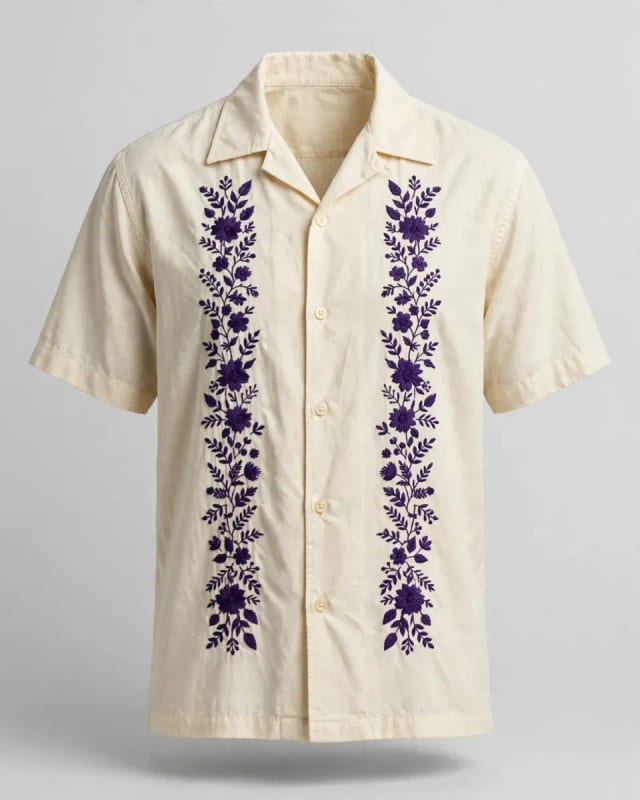
51 / Embroidered camp shirt
Repeated concepts are not identical products. This is a separate Meta-generated shirt from the other embroidered examples. Similar colour words do not establish correspondence of motif geometry, fabric or construction.
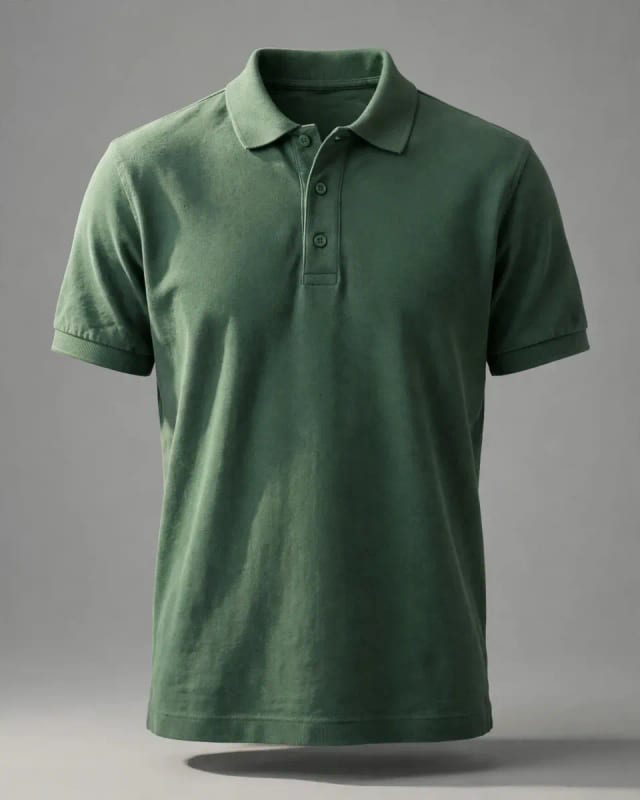
52 / Green polo shirt
Sampling should respect the surface. The collar, sleeve underside and chest have different shading. Choose comparable material regions for an evaluation and state which parts were excluded and why.
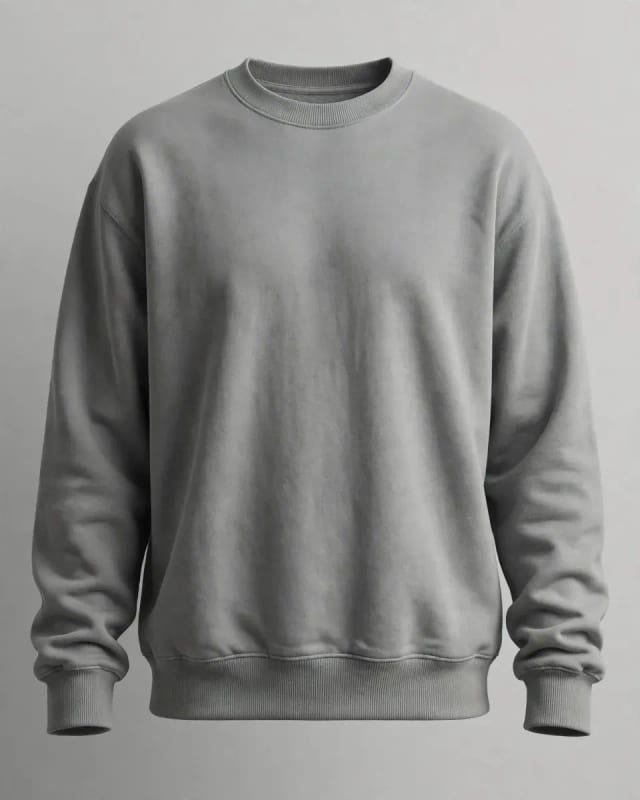
53 / Grey crewneck sweatshirt
Changing composition changes the evidence. Compare how much of the frame is garment rather than background. Whole-image statistics can shift with crop even when the visible fabric itself has not changed.

54 / Rose shirt in a lifestyle setting
A scene introduces competing colours. Skin, trousers, foliage and warm surroundings can influence judgement. A correction confined to the product should not silently recolour these unrelated elements.
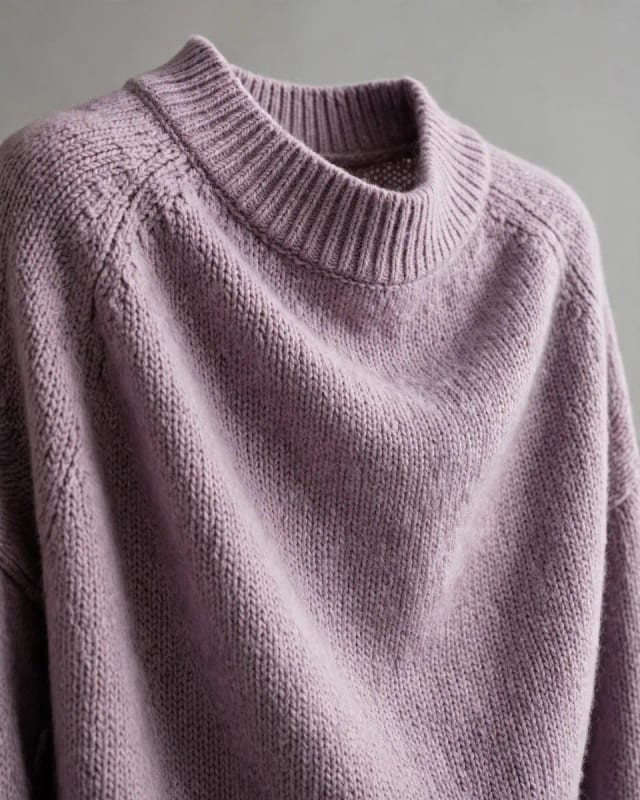
55 / Mauve knit close-up
View scale affects what looks preserved. A close-up makes stitches easy to inspect but omits the full product. Detail coverage and whole-garment coverage serve different purposes; neither replaces the other.
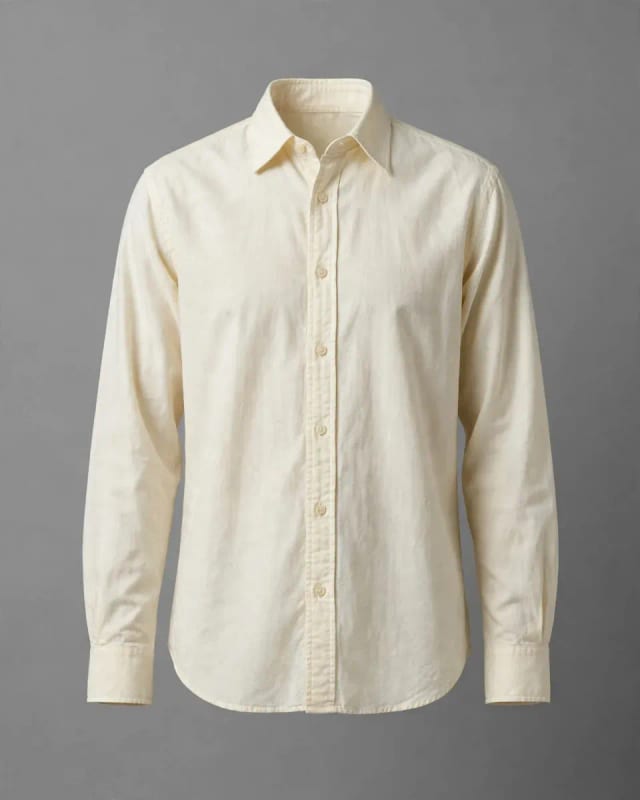
56 / Pale yellow long-sleeve shirt
The reference needs an explicit interpretation. Is the warmth an intended fabric property or a capture cast? This illustration alone cannot settle that. Additional approved references can reduce uncertainty, but do not justify inventing hidden evidence.
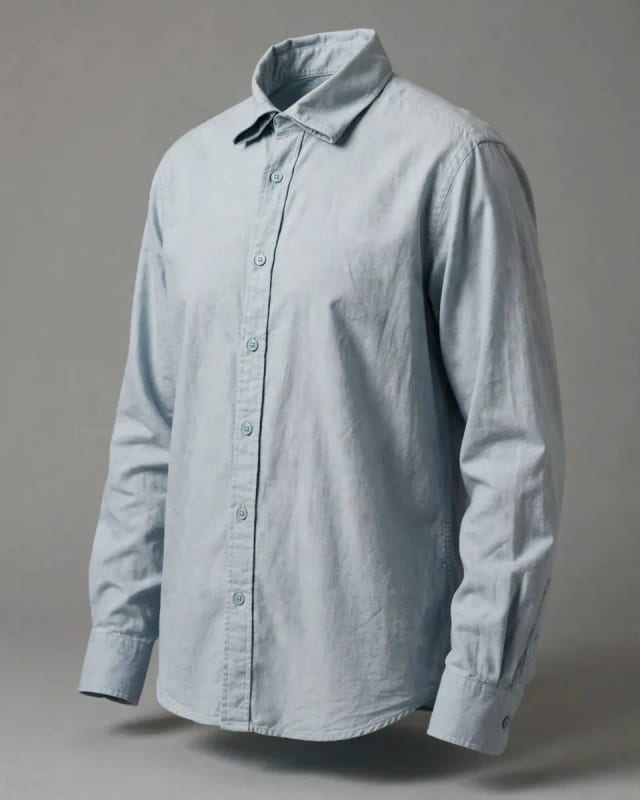
57 / Pale blue-grey shirt
A neighbour colour is a useful hard case. Blue-grey can plausibly be interpreted as neutral grey at a glance. Build evaluation cases around small, meaningful differences rather than only spectacular failures.
58 / Periwinkle cushion
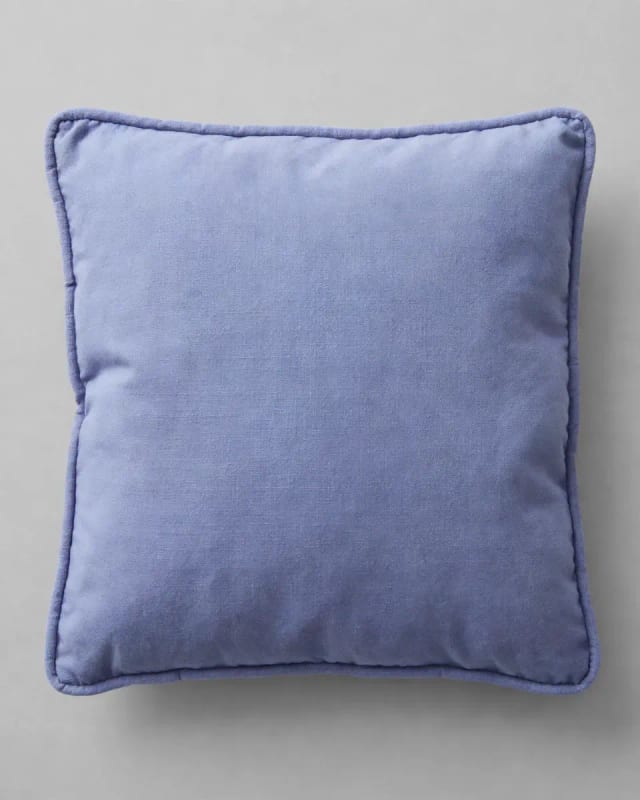
Context can change perceived appearance. Notice the contrast between the blue-violet surface and the neutral surround. The context experiment above isolates surround colour using identical digital swatches; this product illustration itself is not that controlled experiment.
59 / Blue tee on mannequin
A still cannot establish temporal stability. This image is an anchor for a future rotation experiment. Without an accompanying sequence, it supplies no measurement of flicker, no repeatability result and no correction success rate.
From illustration to experiment
What would make these examples evidence?
The atlas is a set of questions made visible. To answer them experimentally, each reference needs an associated candidate, a declared transformation, a comparison protocol and retained outcomes. Two independently generated shirts with similar descriptions are not a valid before-and-after pair. Even repeated prompts can yield different products.
- Reference A: Save the exact asset
- Candidate B: Attach A; change one factor
- Inspect correspondence: Verify identity before scoring
- Evaluate + retain: Include failed attempts
1. Define what should remain invariant
For a viewpoint experiment, garment identity, motif arrangement and material should remain recognisable while visibility, folds and shading may change. For a background experiment, preserve the product while changing the surround. For a lighting experiment, permit physically plausible appearance changes rather than demand identical RGB pixels. These are different hypotheses and should not be combined into one undifferentiated score.
2. Change one factor before combining factors
Begin with a neutral reference and a single perturbation: pose, surround, illumination or crop. Only then study combinations. If pose, camera response, background and lighting all change at once, the resulting error cannot easily be attributed to one cause. A complex lifestyle scene may be commercially useful while being a poor first diagnostic.
3. Verify that the candidate depicts the same item
Check silhouette, construction, motif count and placement before measuring colour agreement. If the generator redraws the embroidery, a numerical colour comparison may no longer address the intended question. Record that as an identity failure, not as a conveniently excluded colour sample. The mostly plain top in the pattern chapter is a concrete reminder that a requested pattern is not guaranteed to appear.
4. Keep measurement and judgement separate
Use comparable encodings and reference-white assumptions for colour distances. State whether the comparison concerns whole images, material regions or corresponding surface samples. For video, record sample times, playback conditions and how changes in visibility are handled. Report garment interior, artwork, boundaries and unrelated scene regions separately when those distinctions affect the claim.
A human review can ask whether an asset is acceptable for its intended use. A numerical diagnostic can ask whether a defined quantity improved. Neither substitutes automatically for the other. If raters disagree, that disagreement is part of the evidence; it should not disappear behind a rounded headline percentage.
5. Retain repetitions, failures and uncertainty
Save all planned attempts and distinguish prompt revisions from independent repetitions. Keep development products separate from the final evaluation set. Several adjacent frames from one video are not several independent products. Repeated generations of one item are useful for repeatability, but they do not establish broad coverage across materials.
| Claim | Evidence it would need | What this article provides |
|---|---|---|
| The examples illustrate difficult appearance categories. | Labelled, inspectable images with relevant explanations. | 59 synthetic anchors, inspected and captioned. |
| A particular correction improved a defined diagnostic. | Matched inputs and outputs plus a fixed calculation. | Selected development observations; no new public numerical benchmark. |
| The delivered video has no visible flicker. | Sequence review and a specified temporal evaluation with scope and limits. | A still comparison cannot establish this. |
| The system works across product families. | Independent held-out evaluation, coverage and defect counts. | Not established by this atlas. |
Illustrative test plan, not reported results
Suppose a future study uses 12 products, three scene conditions and four independent generations per condition. That produces 12 × 3 × 4 = 144 generated assets, but only 12 product identities. The distinction matters when discussing generalisation. A product-level split would keep every generation of a held-out product out of development. A report should identify both the number of assets and the number of independent product groups.
Hypothetical study inventory:
12 products × 3 conditions × 4 generations = 144 assets
Independent product identities = 12, not 144

Report separately:
reference agreement / temporal behaviour / detail / scene changes
coverage / defects among accepted assets / uncertain cases
A compact vocabulary
- Reflectance: How a material returns incident light; a spectrum or directional description carries more information than a photograph.
- Encoding: The interpretation of image values, including colour-space and transfer-function assumptions.
- Lightness: A perceptual colour coordinate in spaces such as CIELAB; not interchangeable with raw RGB or physical luminance.
- Chroma: Colourfulness relative to a defined reference within a colour model; distinct from hue.
- Gamut: The set of colours representable under a given encoding or reproduction condition.
- Temporal consistency: Coherent behaviour over time, allowing the changes that the scene and motion justify.
- Reference fidelity: Agreement with the approved evidence under a declared comparison, not proof of physical truth.
The displayed Meta AI images came from the supplied shared sessions. Exact model versions and seeds were not verified.
Development research / observations and evaluation
What the work taught us, and what the evidence does not yet establish.
Abstract
Generated product media can remain visually plausible while changing an item's perceived colour. In moving sequences, the mismatch can also vary with viewpoint: a garment may appear consistent in one frame but drift in shade or brightness during rotation. This makes product fidelity a sequence-level evaluation problem rather than a single-image judgement.
Our development work investigated reference-guided colour correction for garment images and videos. The principal observations concern the interaction between colour fidelity, surface detail, boundary behaviour, and temporal consistency. Selected internal regression studies recorded improvements in brightness stability and boundary behaviour, while also showing that improvement on one diagnostic does not establish universal visual correctness.
This article presents the problem, research observations, and implications for evaluation. It intentionally omits the proprietary implementation, model configuration, processing sequence, and calibration procedure. It is a research overview, not a reproducibility paper or an independently validated benchmark publication.
1. A plausible image can still depict the wrong product colour
Generative media is often judged by realism, composition, or aesthetic quality. Product communication imposes another constraint: the depicted item should remain recognisable as the referenced product. A plausible blue garment may still be the wrong blue.
Colour is only one component of that requirement. Shape, pattern, material appearance, logos, and small construction details can also change. Our observations concern garment colour and temporal behaviour; they do not establish preservation of every product attribute.
The central research question is therefore narrower than general realism: how should a generated asset be assessed against reference evidence when its pose, lighting, and scene differ?

2. Photographic references are evidence, not physical ground truth
A photograph records the interaction of material, illumination, camera response, and image processing. Two valid photographs of the same garment may disagree in apparent brightness or shade. Reference agreement cannot automatically be interpreted as recovery of the material's physical reflectance.
This distinction matters for both correction and evaluation. A system can improve agreement with approved photography without demonstrating colourimetric accuracy under arbitrary illumination. Stronger physical claims would require controlled capture and calibrated references.
Reference quality also limits the conclusions available. Inconsistent images, edited photographs, hidden surfaces, and weak coverage of the product create uncertainty that an evaluation should acknowledge rather than convert into an unjustified pass.
3. Still-image fidelity and sequence stability are different objectives
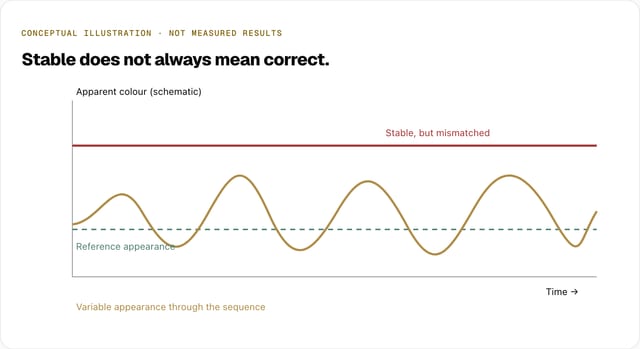
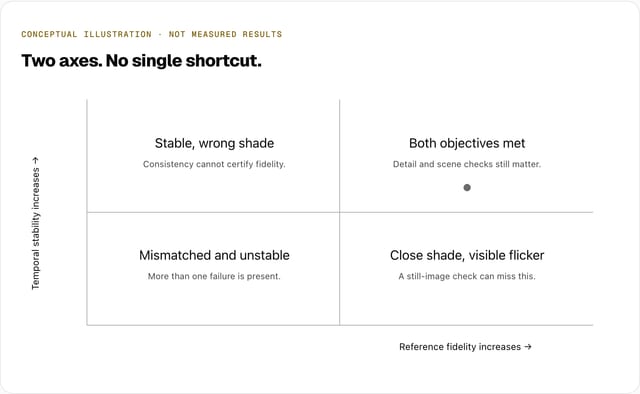
A frame can look convincing in isolation while forming part of an unstable sequence. Conversely, a stable sequence can consistently show the wrong colour. Both dimensions matter.
| Evaluation dimension | Research question |
|---|---|
| Reference fidelity | Does the depicted garment agree with the approved photographic evidence? |
| Temporal consistency | Does its appearance remain coherent through motion and viewpoint changes? |
| Detail preservation | Are patterns, texture, and fine visual features still credible? |
| Boundary behaviour | Do outlines exhibit flashes, halos, or unstable transitions? |
| Scene preservation | Are unrelated areas of the scene affected? |
| Evidence quality | Is there enough reliable information to reach a conclusion? |
A single average score can hide a failure in one of these dimensions. Evaluation should preserve their distinctions and examine difficult portions of a sequence, not only representative stills.
4. Boundaries can dominate perceived instability
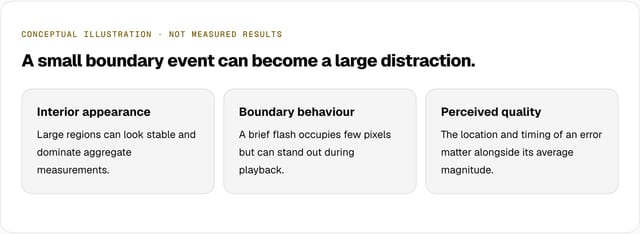
One recurring development observation was that visible instability could remain around garment outlines even after the interior appearance improved. Such events can be brief and spatially small, yet conspicuous during playback.
This suggests that overall colour agreement and whole-frame averages are insufficient descriptions of video quality. Evaluation should consider where an error occurs, how abruptly it changes, and whether it persists across motion.
The observation does not imply a single cause for every edge flash. Source instability, uncertainty about the visible surface, motion, and export interpretation can contribute differently across cases. Diagnosing the source of an artefact is separate from measuring its visible effect.
5. Light fabrics and printed surfaces expose coupled failure modes
Light garments can be difficult to distinguish from bright surrounding scenes. Small variations that might be inconspicuous on a dark surface can become perceptually prominent on a nearly neutral fabric.
Printed garments introduce another complication: the fabric and artwork are distinct visual evidence within one product. A statistic that improves for the fabric may conceal a change in the print. Evaluating them as one uniform region can therefore produce a misleading conclusion.
The broader implication is that evaluation should account for material and surface structure. Results from a plain garment should not be assumed to transfer to intricate artwork, translucent fabric, reflective finishes, or other substantially different appearances.
Actual development example · archived revision
Reference, generated input, corrected output.
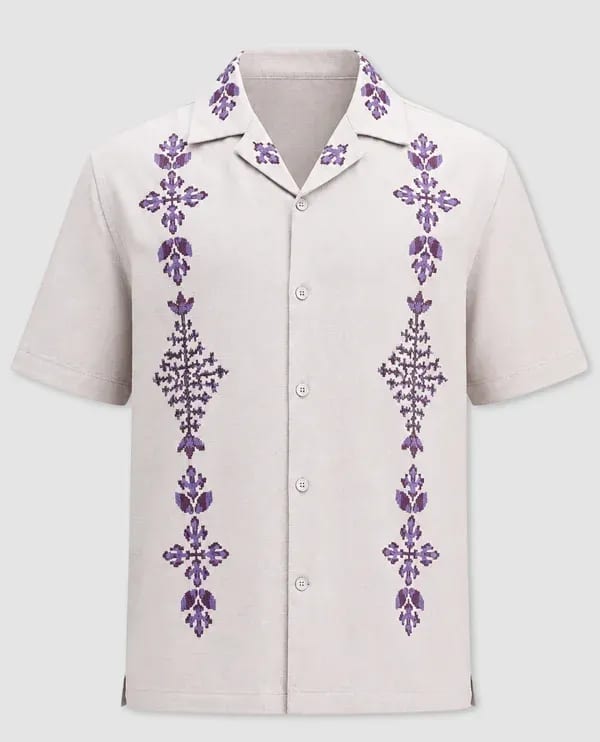
Reference photograph supplied to the workflow
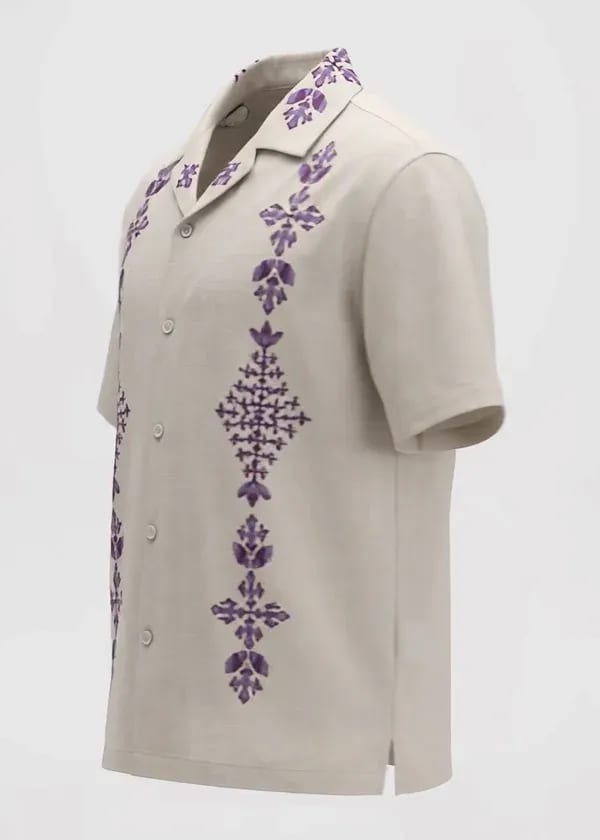
Generated input · 1.00 s
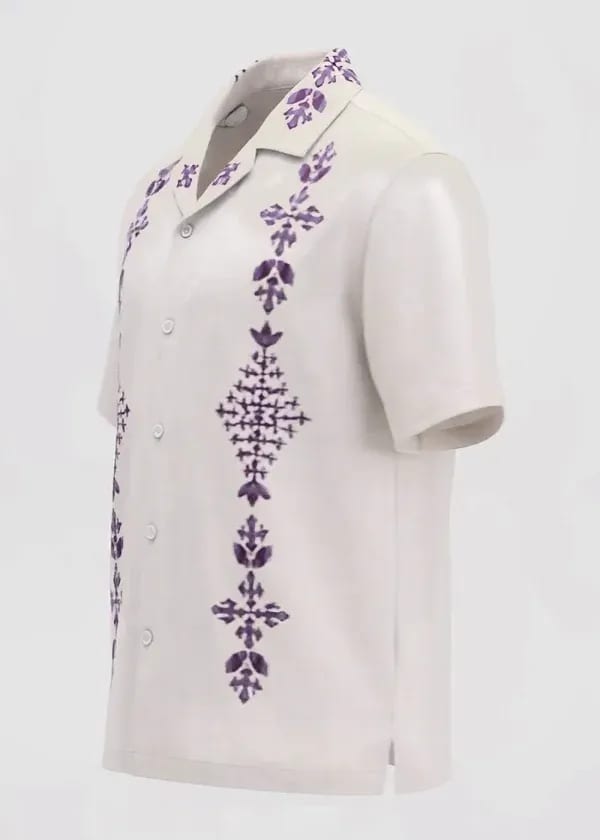
Corrected output · same 1.00 s
Real assets from one development case, not the synthetic examples elsewhere in this article. The input and output use the same timestamp and identical crop; the reference shows a different pose and lighting. Images were cropped and resized for presentation, with no additional colour adjustments. The corrected frame is from an archived development revision, not a claim about every current output. Compare the base fabric, embroidery and outline; residual differences remain. A still frame cannot establish temporal stability or prove that flicker is absent.
6. What the development evidence supports
Selected internal comparisons recorded reductions in a boundary-related temporal diagnostic and in brightness variation on a light garment. A controlled regression also showed zero sensitivity to one specifically tested disturbance. These observations supported continued development, but do not establish zero visible flicker.
| Observation | Supported interpretation | Unsupported extension |
|---|---|---|
| Lower boundary-related temporal diagnostic in a selected case | The revised system improved that internal diagnostic for the observed case | All boundaries are stable in all videos |
| Lower brightness variation in a selected light-garment case | The tested sequence became more stable under the chosen measurement | Every white garment is correctly matched |
| Zero response in one controlled regression | A particular tested dependency was eliminated under fixed conditions | All visible flicker was eliminated |
| Successful image and video processing checks | The workflow could complete the tested application paths | Catalogue-wide visual accuracy or production-scale reliability |
These cases were used during development. They are not an untouched test set, and they do not provide an independent population-level success rate. Public numerical benchmark claims would require a sufficiently specified evaluation protocol, independent evidence, and permission to release the relevant data. This overview does not provide that package. The worked calculations later in this article use synthetic data solely for teaching.
7. A more useful evaluation framework
Reference fidelity and temporal stability should be reported together, with preservation of detail and scene content treated as additional constraints. An asset should not be considered successful simply because one metric improves.
Human assessment remains useful for visible failures that aggregate measurements can miss. Numerical diagnostics can support that assessment, but a colour-distance measure, a temporal residual, and a human judgement answer different questions. They should not be presented as interchangeable.
Independent evaluation should separate development examples from final assessment by product family. Related variants and repeated generations can otherwise make generalisation appear stronger than it is. Adjacent video frames are also correlated and should not be counted as independent products.
For an automated acceptance system, the rate of accepted assets should be reported alongside the rate of defects among accepted assets. A system that sends difficult examples for review may be more useful than one that produces a confident answer for every input. No calibrated acceptance classifier is claimed here.
Mathematical interlude: learning to measure the problem
All numerical examples below use deliberately constructed synthetic data. They are teaching examples, not customer data, measurements of our system, or substitute benchmark results. The equations describe general evaluation concepts, not our proprietary correction method. Calculations assume comparable colour encoding, equal sampling intervals, and the same visible material across samples unless stated otherwise.
A. Colour distance: separating lightness from chromatic difference
CIELAB describes colour with L* for lightness and a*, b* for opponent chromatic coordinates. A simple teaching measure is Euclidean distance in this space, conventionally called ΔE*ab or ΔE76. Konica Minolta's colour-difference explanation introduces these coordinates and the distance calculation.
Reference r = (60, 10, −20)
Candidate c = (64, 13, −16)

ΔL* = 64 − 60 = 4
Δa* = 13 − 10 = 3
Δb* = −16 − (−20) = 4

ΔE76 = √[(ΔL*)² + (Δa*)² + (Δb*)²]
     = √(16 + 9 + 16)
     = √41 ≈ 6.40
This number describes separation between the supplied coordinates; it does not explain why the colours differ. Changing only lightness would produce a different error from changing the chromatic coordinates, even if the total distance were similar. The example assumes the same reference white and observer convention for both values; comparing incompatible colour conversions would undermine the result.
ΔE76 is convenient for teaching but is not uniformly perceptual. CIEDE2000 is a more elaborate colour-difference formula with distinct weighting and interaction terms. It must not be substituted by Euclidean distance and then labelled ΔE00. For implementation details and published verification pairs, see Sharma, Wu and Dalal's CIEDE2000 notes. Neither formula alone supplies a universal product-acceptance threshold.
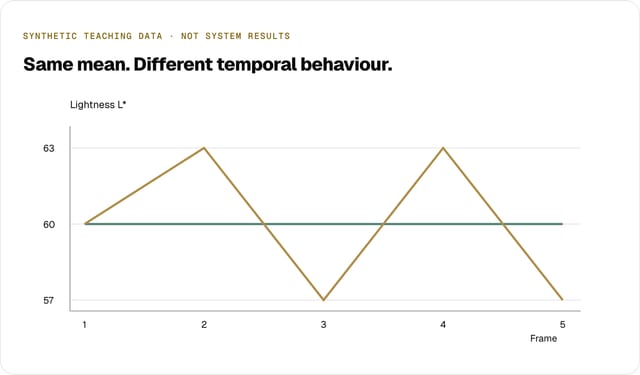
B. Mean agreement can hide variation over time
Consider two synthetic five-frame sequences of lightness measurements from a comparable surface. The reference lightness is 60 throughout this simplified example.
| Frame | Sequence A | Sequence B | Reference |
|---|---|---|---|
| 1 | 60 | 60 | 60 |
| 2 | 60 | 63 | 60 |
| 3 | 60 | 57 | 60 |
| 4 | 60 | 63 | 60 |
| 5 | 60 | 57 | 60 |
Both sequences have mean lightness 60. Measuring only the difference between the sequence mean and the reference would therefore return zero for both. For B, signed deviations cancel even though four frames differ from the reference.
Mean absolute reference error = (1/T) Σ |Lₜ − Lref|
A: 0
B: (0 + 3 + 3 + 3 + 3) / 5 = 2.40 L* units

Mean adjacent-frame change = (1/(T−1)) Σ |Lₜ − Lₜ₋₁|
A: 0
B: (3 + 6 + 6 + 6) / 4 = 5.25 L* units per sampled step

Largest adjacent-frame change for B = 6 L* units
The first quantity measures reference disagreement; the second measures temporal variation. A third sequence fixed at 66 would have reference error 6 and temporal variation zero. Stability alone therefore cannot certify fidelity.
These are illustrative statistics, not validated flicker scores. Real rotation changes illumination and visibility. Samples must correspond to comparable surfaces, and frame timing must be documented: a per-step measure changes with sampling rate. A moving highlight can raise temporal variation without being an error; an average over changing surface areas can also mislead.
C. Spatial averaging can hide an edge defect
Suppose 98% of an evaluated region has scalar error 1, while the remaining 2% (a thin boundary) has error 20. The numbers represent an abstract nonnegative error score, not a specified perceptual metric.
Region-wide mean error = 0.98 × 1 + 0.02 × 20
                       = 0.98 + 0.40
                       = 1.38

Boundary-only mean error = 20
A region-wide mean of 1.38 could look reassuring while concealing a severe local problem. Under the nearest-rank definition, even the 95th percentile equals 1 in this example, because the problematic pixels occupy only the upper 2%. The 99th percentile equals 20. This illustrates why spatially targeted evaluation and the choice of tail statistic matter. It is not an argument for using a maximum alone, which may overreact to isolated noise.
D. Quantifying improvement without claiming perfection
Imagine a defined diagnostic falls from 5.25 to 1.75 in a hypothetical experiment using the same measurement protocol.
Relative reduction = (before − after) / before × 100%
                   = (5.25 − 1.75) / 5.25 × 100%
                   ≈ 66.7%
That is a 66.7% reduction in this diagnostic, not 66.7% accuracy, not proof of equivalent perceptual improvement, and not zero remaining error. The comparison would be invalid if the measurement region, sampling, or definition changed between candidates. When the baseline is zero, this relative-reduction formula is undefined.
E. Acceptance coverage and escaped defects
A useful automated system must balance how much it accepts against how often those accepted assets contain defects. Consider a synthetic evaluation of 100 independently assessed assets: 80 are accepted, and human review finds four defective assets among those 80.
Acceptance coverage = 80 / 100 = 80%
Defect rate among accepted assets = 4 / 80 = 5%
Defective accepted assets as a share of all assets = 4 / 100 = 4%
The last two percentages have different denominators and answer different questions. This information alone does not determine the fraction of all defective assets that escaped detection: the total number of defective assets, including those rejected, is still needed. A reported percentage should always identify its numerator, denominator, and evaluation population.
Together, these examples show why a credible evaluation needs more than a single headline score. Mathematical definitions make claims inspectable without disclosing the mechanism that produces the corrected output.
8. What remains unresolved
The hardest conceptual issue is distinguishing unwanted appearance drift from legitimate changes in illumination and viewpoint. Removing all visible variation would also remove part of the physical appearance of a moving garment.
Reference uncertainty, occlusion, intricate patterns, weak contrast, and changing visibility remain important challenges. Colour fidelity alone cannot certify product identity, accurate text, material properties, or construction details.
The development evidence is also limited in scope. It does not establish universal performance, independent commercial acceptance rates, or applicability to every material category. Broader claims require broader evaluation.
9. Implications for research and deployment
The research direction is to treat product fidelity as a constrained, evidence-based judgement. A generated asset must be assessed against the product evidence and across time, while allowing legitimate scene variation.
Future work should investigate independent evaluation across product families, clearer treatment of uncertain references, and agreement between numerical diagnostics and human perception. Any learned evaluator should be assessed on held-out products rather than assumed reliable because it uses a capable pretrained model.
For deployment, output generation and output acceptance are separate milestones. Operational completion demonstrates that a job ran; it does not demonstrate that the resulting asset is suitable for publication. Quality evaluation and failure handling remain necessary parts of the research problem.
10. Conclusion
Our development work suggests that reference fidelity, temporal consistency, surface detail, and boundary behaviour must be considered together. Improvements in one dimension can coexist with visible failures in another.
The contribution of this overview is a set of research observations and evaluation implications drawn from development experience. The underlying implementation remains undisclosed. Independent validation is the next requirement for stronger performance claims.
Evidence and disclosure
This overview is based on internal implementation inspection, selected development regressions, and application-level checks. Customer identities, brand names, product identifiers, and private conversations are excluded. One authorised garment-only development comparison is included without identifying labels.
Exact model selections, proprietary correction algorithms and formulas, parameter values, routing rules, processing order, source modules, deployment configuration, and implementation artefacts are intentionally not disclosed. The article is not sufficient to reproduce the system. It also makes no claim that high-level ideas cannot be independently developed by others.